Capture Rate – what is it?
The challenge for our retail clients is whether sales in their bricks–and–mortar stores are as good as they can be.
A store’s Capture Rate is the percentage of footfall in the street or shopping destination that enters a store and represents that store’s market share in a location. Capture Rate establishes how a store is faring relative to its location and whether it’s maximising its trading potential in that location. Ideally, a store’s Capture Rate should be increasing – it’s growing its market share, which of course is the lifeblood of any business.
The Capture Rate is an important metric to measure for three reasons:
- Conversion Tracking: Retailers can track the effectiveness of their sales efforts and marketing strategies. A high capture rate suggests successful conversion of in store footfall into actual sales.
- Identify Growth Opportunities: By monitoring capture rates regularly, retailers can identify trends and opportunities for growth. Through the analysis of high and low capture rate periods, retailers are able to adapt their strategies to capitalise on busy times and boost sales during slower periods.
- Understand and Enhance your Customer Experience: In this day and age, data-driven insights into your target consumer’s purchasing behaviours is critical. By understanding capture rates, retailers can tailor the shopping experience to enhance the consumer experience.
Valuable insights can be gained from tracking store sales against market performance. That’s why data from MRI OnLocation’s UK footfall data has been so widely adopted by the industry, media, academia and the government. With a correlation of 78% between store sales and footfall in UK retail destinations, there is no denying that footfall is a key contributor to store success.
Access to footfall data from the street entering the store makes it possible to calculate conversion, which is a key performance metric. However, retailers also need to understand context: the success of the store relative to its location. Is the store capturing as much trade as it could be in that town or shopping centre, or is it underperforming? The answer lies in identifying the store’s Capture Rate.
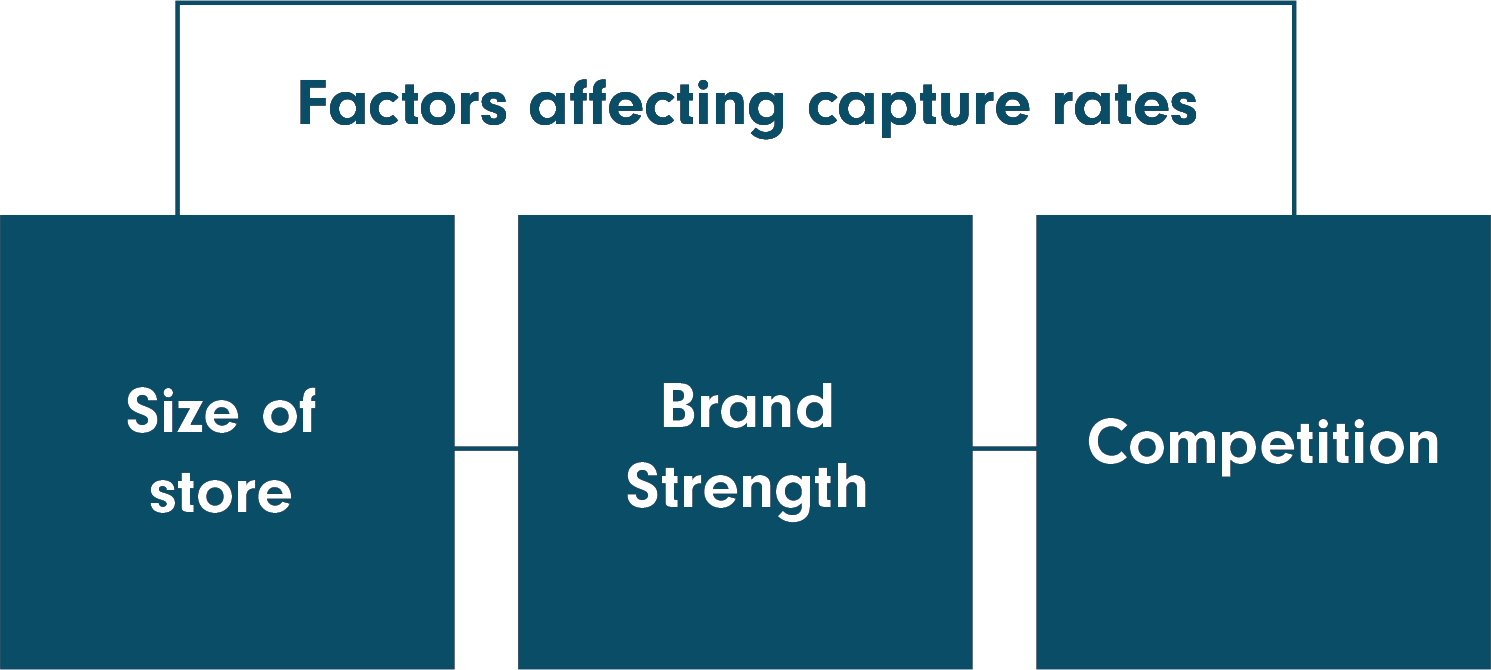
Capture Rates reflect a combination of three factors:
- breadth of offering
- brand strength
- competition
The influence of each factor varies across different types of retailers. Stores with the greatest offering and brand strength with the lowest amount of competition places them in a unique position providing them with the highest Capture Rates.

State of the Retail Landscape in 2023
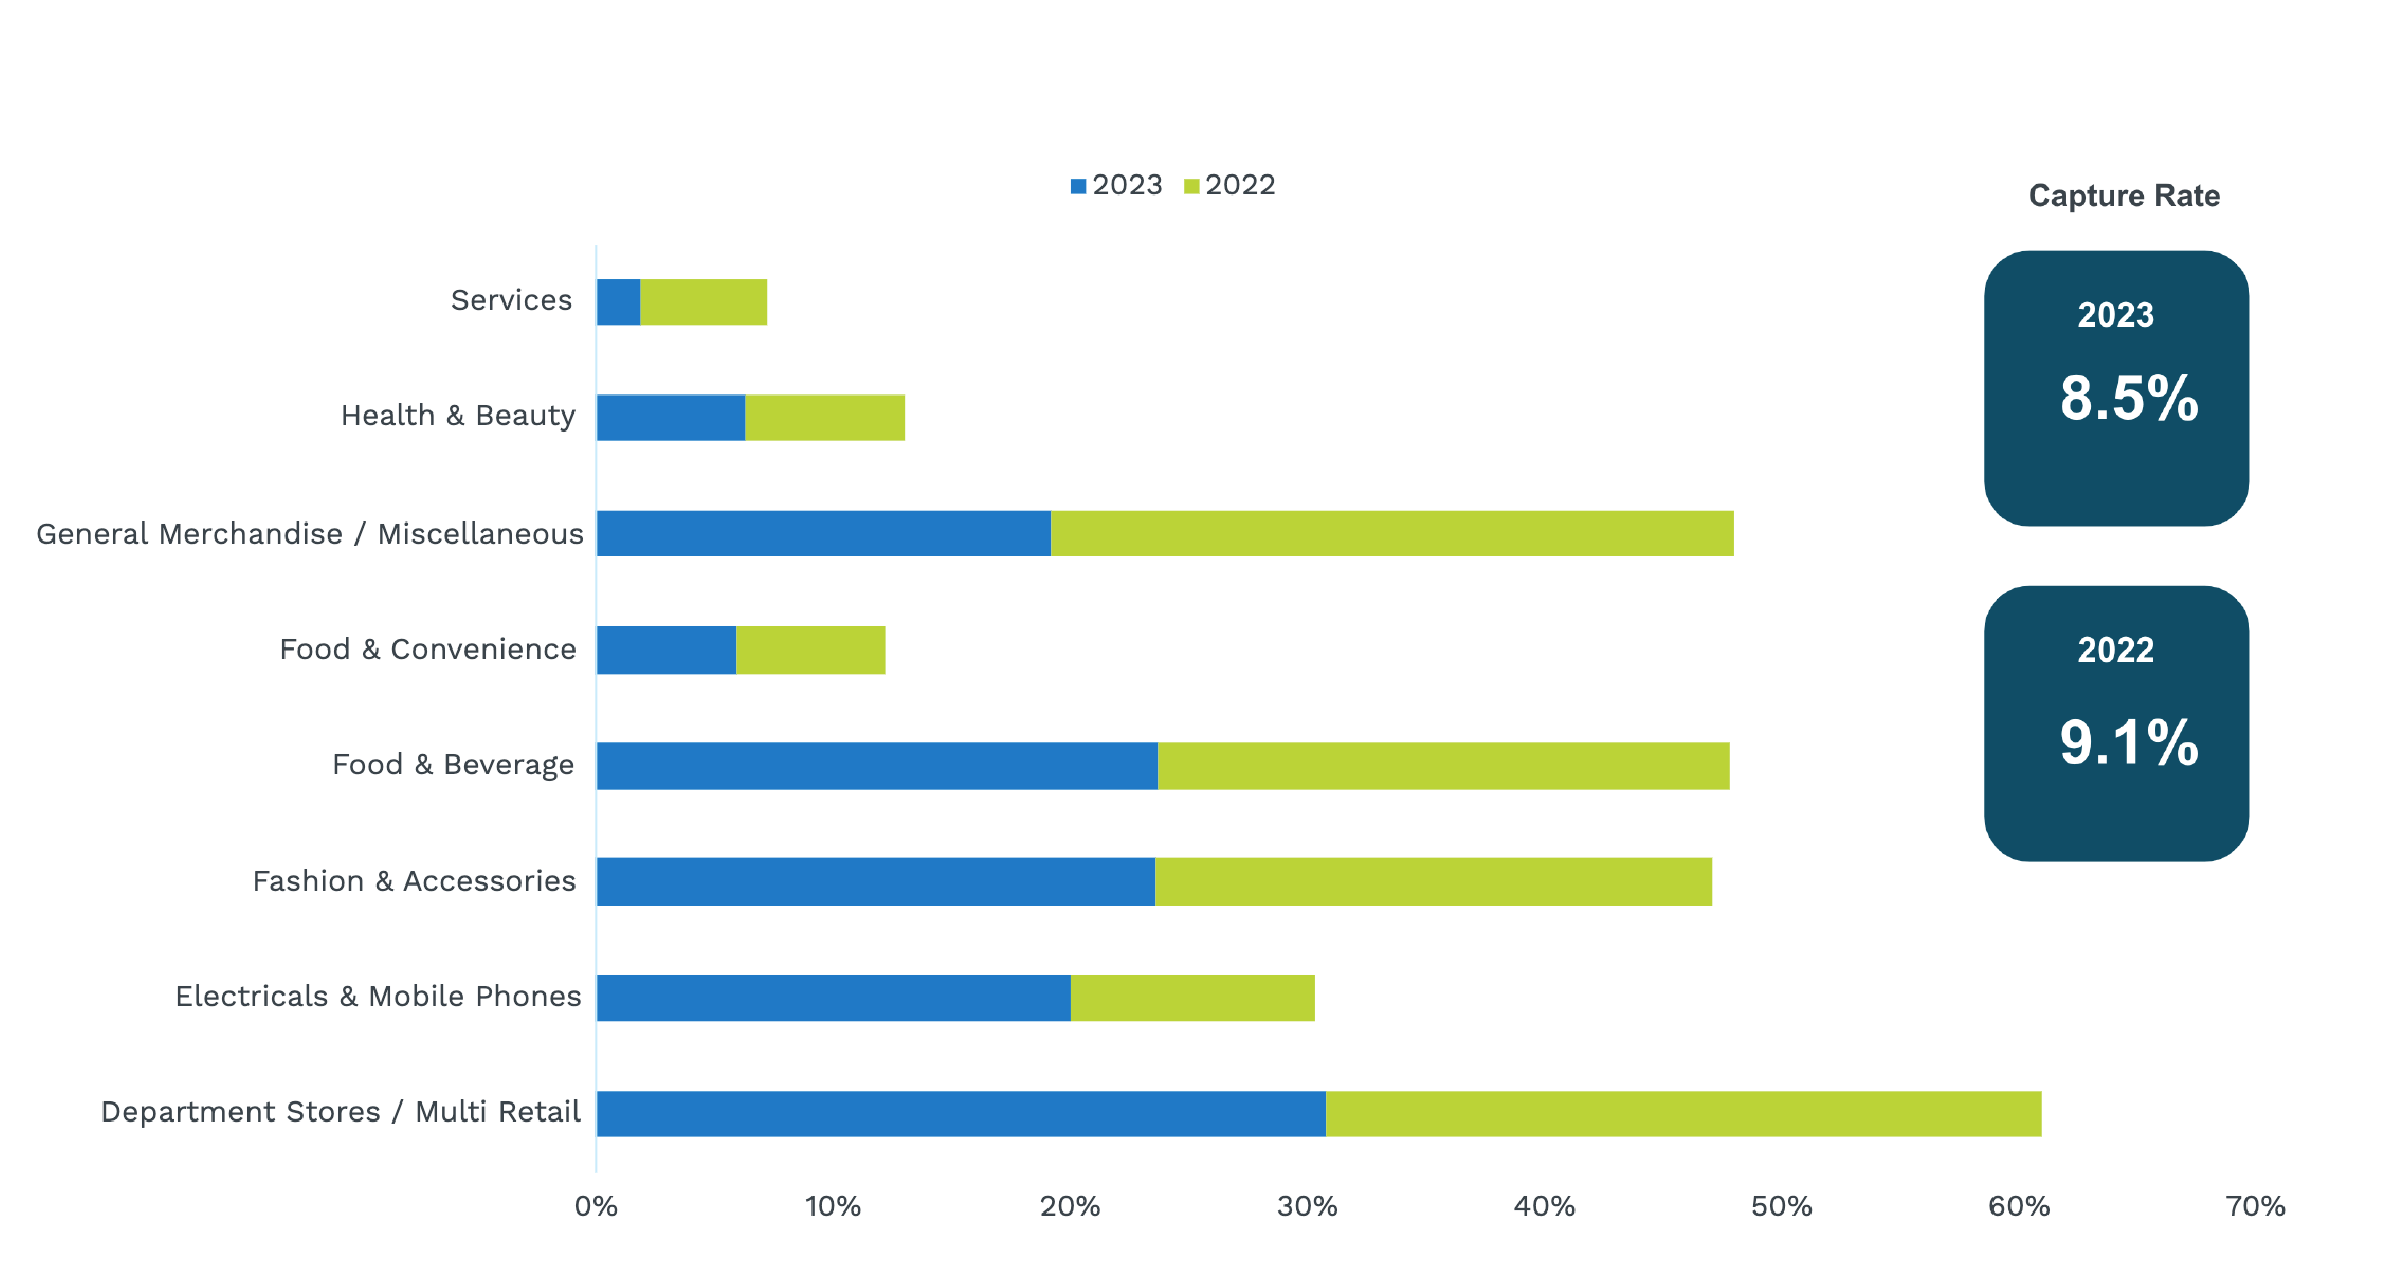
Since 2017, there has been a decrease in capture rates nationally. However, given the state of the economy in 2023 it’s unsurprising that capture rates dipped to 8.5% from 9.1% in 2022. Department stores remained resilient with a marginal rise from 2022 to 30.8%. However, food and beverage, general merchandise, health & beauty, and food and convenience all witnessed decreases of varying degrees from 2022.
To provide context, department stores, with the greatest offerings, brand strength and lowest level of competition, tend to have the highest Capture Rate of the 10 retailer categories we monitor at MRI Software. Services, Health & Beauty and Electrical & Mobile Phones – of which there are many competing brands with a narrow offer – have the lowest Capture Rate.

Capture Rates also vary between stores within a network, depending on the extent of competition within different locations as footfall can be spread across a larger number of stores due to the wider available choice. Stores in locations with more competition – typically those with higher footfall – will generally have lower Capture Rates than stores in locations with less competition. But inevitably there will be outliers – stores that have lower than expected Capture Rates. Identifying these stores provides opportunities to uplift the performance of individual stores and therefore the network as a whole.
Trends identified within a store’s Capture Rate over time highlights whether a store is maximising its potential or underperforming. A store should aim for its Capture Rate to be at least stable, but preferably increasing, over time. When a store’s Capture Rate is declining, it indicates that customer numbers in store are either dropping by more than in the location, or customer numbers in store are not increasing at the same rate as external footfall. Under either scenario, the store is losing market share and its performance is diminishing.
At the heart of every retail strategy lies data-driven insights; the ability to create a tailored experience and understand your core audience online and offline will be critical to the trading success for retail in 2024. Being able to measure efficiencies will also be key in ensuring targets are met whether they be profit or operational centric.
As the retail landscape continues to transform, harnessing the power of data will be instrumental for sustained success.
Check out our next blog on how to enhance your Capture Rate and enable growth for your bricks and mortar stores.
Footfall Analytics
Boost performance with actionable insights based on AI-driven footfall analytics

MRI OnLocation UK Monthly Commentary – May 2025
UK retail footfall remains steady in May as half-term holiday boost offsets cautious consumer spend MRI Software’s latest retail footfall data for May revealed that retail footfall across the UK saw a marginal dip in May compared to last year.

