

Save time
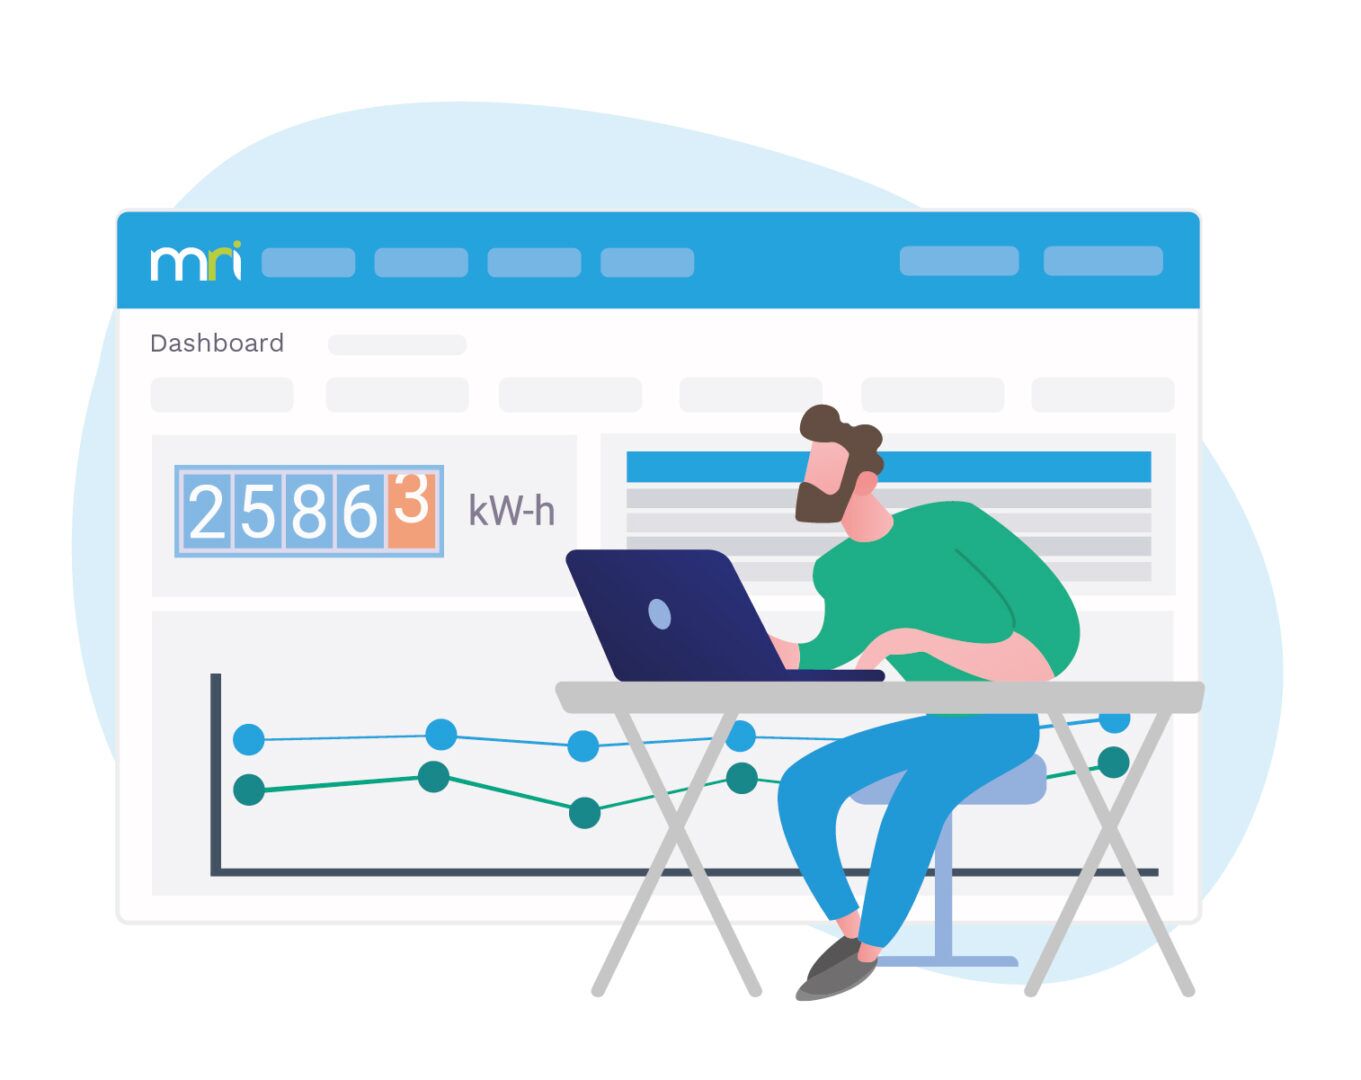
Quickly and easily access energy information including KPIs, trends, and detailed data, in one of two formats to suit the end user.
Build engagement
Brand your energy dashboards for a stunning visual experience to share across your organization or showcase to a wider audience.
Drive change
Instantly spot anomalies or alarms on technical dashboards to enable rapid response and drive down energy consumption.
It takes a spark to ignite change
You want to drive down energy costs fast, but what will bring everyone together to make it happen – from technicians to investors and from management to customers?
Your energy project will fizzle out unless it has a centralized dashboard to visualize energy data and ignite the change to reduce consumption and drive down costs.
But don’t settle for a one-size-fits-all dashboard. That will only frustrate users and hamper the change agents. Why?
Because technicians need real-time access to granular data and alerts while everyone else (staff, visitors, students, and the public) needs stunning, interactive displays, accessible in the lobby or on mobile, that show consumption by location, country, or company usage.
Do you have the spark that will inspire and unite your organization behind the change?
MRI Energy dashboards inform, inspire, and unite organizations behind change
Reduce energy consumption and cut costs with engaging, actionable, and customizable information at a glance

Easy customization
Create the display you need. Drag and drop widgets, charts, tables, websites, gauges, and numeric displays on to the dashboard. Resize, reposition, and specify a data source. Customize to fit your corporate branding.
Central configuration
Save time by configuring your energy management dashboards centrally. Just change the data source feeding into the master dashboard to drill down into individual companies, meters, and time periods at the click of a button.
Map navigation
Easily navigate between locations and zoom in to see individual sites. Create map views across local or global property portfolios. View alarms and scaled consumption bubbles to quickly identify the highest consuming sites.
3 steps to ignite and inspire change in your energy consumption
1. Book a demo
Tell us the challenges you want to solve and we'll show you how how our software works.
2. Customize your dashboard
Select the tools you need to drive change and customize your display to help you achieve it.
3. Ignite change
Display consumption, reduction, and progress against goals to all your stakeholders.
Stay updated with the latest energy management news and views
Resources
Let's Connect
Get tailored advice and schedule your custom demo with an MRI expert
