Multifamily rental growth and occupancy update March 2024
This report looks at overall occupancy levels and rental growth trends for twelve markets across Texas, Arizona, Georgia, Tennessee, North Carolina, and Florida.
March brought disappointment to those anticipating the traditional start of the “fast leasing season,” hindering hopes for some occupancy recovery. March’s demand or absorption of units was no match for the elevated number of units delivered in any of the metro markets we cover.
New construction deliveries have skyrocketed to a 40-year high. As supply surges, demand or job growth is settling, moving lower from the historic highs recorded during the economic reopening in 2021.
Even though job growth, the engine that drives absorption, is decent, it is moving in the opposite direction of supply. The combination of increased supply and decreased job growth is a recipe for weaker fundamentals. In addition, the ongoing trend of move-outs in the stable product of Classes B, C, and D further deteriorates overall occupancy levels.
Read on for more discussion on how occupancy and rent levels are responding to this less-than-positive setup.
Occupancy
Figure A compares occupancy levels at the end of 2021 to those at the close of March 2024.
As 2021 ended, occupancy levels were near all-time highs driven by the spike in leasing activity from the economy reopening after COVID shutdowns.
Occupancy levels in all metros fell throughout 2023 as move-outs from older, typically stable properties accelerated and new supply outpaced absorption or demand. This pattern persists, pushing occupancy levels ever lower as the first quarter of 2024 ends.
Austin has the largest drop in occupancy of the twelve metros listed below at -7.4 percentage points. Jacksonville has the second largest decline in occupancy at -6.1 percentage points. These two metro markets are likely to hold their dubious positions throughout 2024 as they work down large quantities of units under construction in their respective areas.
San Antonio, unfortunately, merits mention as the third-largest loser in occupancy with a decline of 5.9 percentage points.
The magnitude of occupancy decline lessens as you move from left to right with Nashville dropping only -3.0 percentage points from the highs of 2021 to the most current reading of 89.6%. The yellow highlights draw your attention to those markets whose overall average occupancy remains above 90%, a threshold where a market transitions from a “Landlord Market” to a “Renter Market” and concessions increase.
Of the 12 markets we serve, only three are holding occupancy levels higher than 90%: Orlando at 90.1%, Tampa at 91.7%, and Phoenix-Tucson at 90.1%.
In March, all markets experienced decreases in occupancy compared to February except for Nashville and San Antonio, which maintained their occupancy levels. No market saw increased occupancy levels during March.
Figure A – Occupancy Analysis – Year-end 2021 compared to March 2024

In Figure A, Stable Occupancy is calculated by removing the properties that are in lease-up from the overall occupancy calculation. This exercise provides insight into the strength of market conditions.
As occupancy has continually decreased since 2021, occupancy of the existing, stable product has fallen as well, due to the Shadow Market disruption of Single-Family Rentals (SFR’s). Monitoring the stabilized occupancy statistic throughout 2024 will be crucial in determining whether Shadow Market disruption persists.
During March, the stabilized occupancy levels fell in all markets except Phoenix-Tucson, which held flat at 92.4%. The drop in occupancy levels for stable product indicates net move-outs in Classes B, C, and D.
Figure B illustrates how the variance between Units Delivered and Units Absorbed in the past 12 months impacts occupancy in each metro area. In addition, the ‘Units Delivered as a Percentage of Overall Supply’ column is a weighted comparison of new supply in each metro. This approach provides a metric to analyze and compare the varied degrees of over-supply among the metro areas.
Figure B – Supply, new units delivered, and absorption analysis
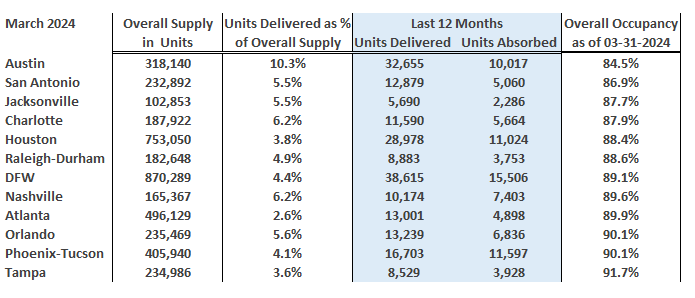
The metro order of Figure B is based on overall occupancy percentages from lowest to highest, placing Austin in the first position with the lowest occupancy.
It becomes apparent that Austin’s low overall occupancy is a function of its large number of new units delivered (32,655). This number of deliveries surpasses that of Houston (28,978), a metro that is almost two and a half times larger than the size of Austin in terms of Overall Supply in Units.
Further analysis shows that Austin’s new Units Delivered account for 10.3% of its Overall Supply, towering over the next closest metros, Nashville and Charlotte, at 6.2%. Metros such as Austin, Charlotte, and Nashville have historically operated in the range of 4.5% to 5.5% when it comes to new supply as a percentage of overall supply.
All metro markets on this data table are experiencing varied degrees of supply difficulty. Hopefully, the expected “fast leasing season” will materialize in April and continue through August. During this time, absorption will have its best chance to outpace deliveries. If it does, the occupancy declines shown in Figure A will reverse.
Additionally, the issues of over-supply can be remedied with population and job growth. All these sunbelt metro markets are masters at generating corporate relocations and are leaders in economic development, the catalysts for growth.
Current rent growth
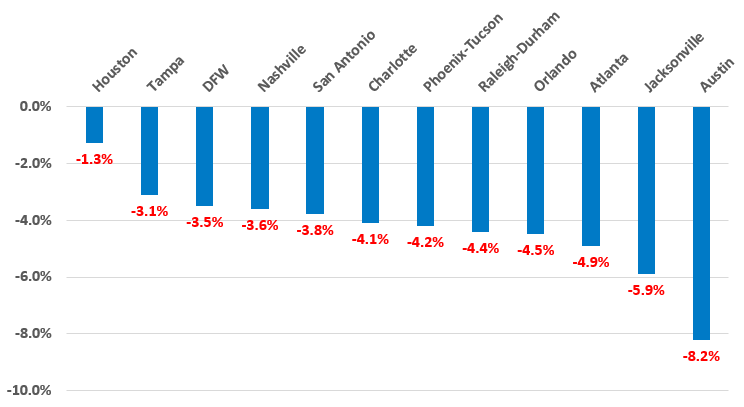
The weak occupancy performance discussed above leads to decreased rent levels. Figure C shows that no markets were in positive territory as of the end of March. All markets realized significantly lower rent growth during March.
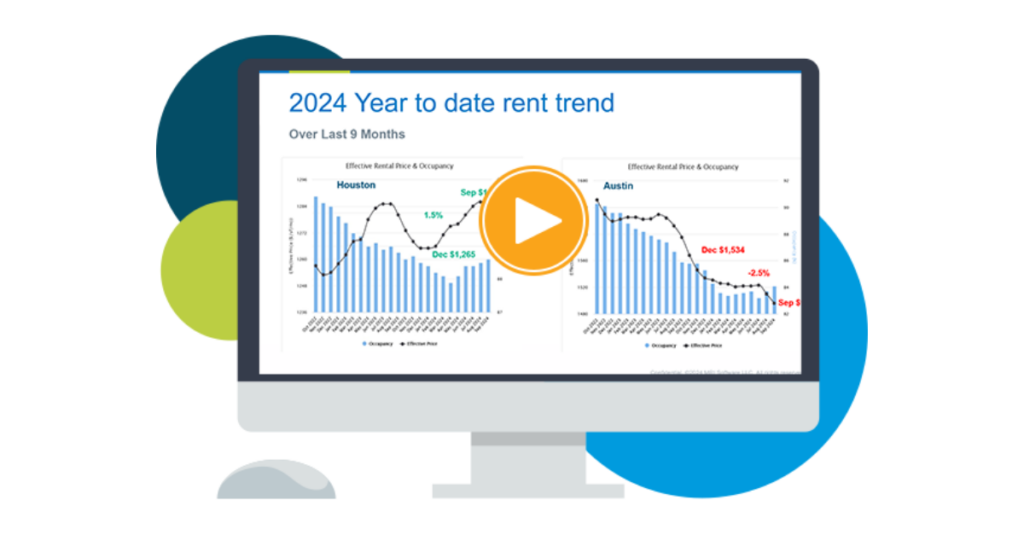
Figure C – 12-month effective rent trend as of March 2024
Concessions become increasingly prevalent as occupancy levels weaken and contribute more to the negative direction of rent growth.
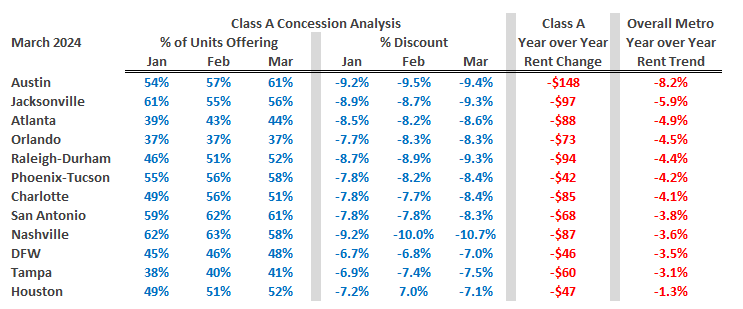
Figure D provides an analysis of the prevalence and magnitude of Class A concessions for the first three months of this year. The metro markets are organized from the worst rent trends to the best.
In Austin, which experienced the worst rent trend, there was a four-percentage point increase in the number of Class A units offering a concession from February to March. Additionally, the magnitude of concessions being offered eased from -9.5% off-market in February to -9.4% in March. This concession activity deteriorated rent levels, effectively lowering the overall rent trend for Austin to -8.2% and dropping Austin’s Class A rents by $148 over the last 12 months.
Houston, with the best Overall Metro Year over Year Rent Trend at -1.3%, had a one-percentage point increase in the number of units offering a concession, as well as a 0.1% increase in the effect of concessions.
Nashville is noteworthy for its percentage discount having reached -10.7%. As a benchmark, a one-month-free concession equals a discount of -8.3%.
Figure D – Class A concessions analysis March 2024
Concessions are likely to remain elevated. However, with the onset of the “fast leasing season,” there may be a respite from expanding concessions as leasing velocity increases.
Prospects for 2024
2024 is off to a dismal start as each month of the first quarter has witnessed declines in occupancy and rent levels.
Unfortunately, all markets are contending with the unfavorable conditions arising from historically high levels of new construction deliveries, which are overwhelming any demand or absorption that can be generated. To make matters worse, existing properties are losing occupancy to the SFR Shadow Market which continues to grow in both size and appeal.
Chances for improvement were lost in March. For prospects to begin improving this year and mitigate the mounting losses so far, April must kickstart the “fast leasing season” to stem or reverse the current trajectory of these markets.
Stay tuned as we continue this series with updated reporting on market conditions through the end of 2024.
Interested in learning more? View additional detail on rental rate, occupancy and absorption trends in our monthly Market Line Reports.
Multifamily market transitions: the changing dynamics of supply, demand, and financing
The multifamily market activity we’ve witnessed since the end of the global pandemic has become a familiar pattern of instability, characterized by extreme shifts in rental growth, supply levels, and absorption rates. Several factors, including the m…