Multifamily rental growth and occupancy update January 2024
This analysis looks at overall occupancy levels and rental growth trends for twelve markets across Texas, Arizona, Georgia, Tennessee, North Carolina, and Florida.
As 2024 begins, the two main factors that plagued market conditions in 2023 are still present. New construction deliveries have skyrocketed to a 40-year high. As supply surges, demand or job growth is settling, dropping from the historic highs recorded during the economic reopening in 2021. Although job growth, the driver of absorption, is decent, it is moving in the opposite direction of supply. The combined increase in supply and decrease in job growth is not conducive to the development of stronger fundamentals.
Read on for more discussion on how occupancy and rent levels are responding to this less-than-positive setup.
Occupancy
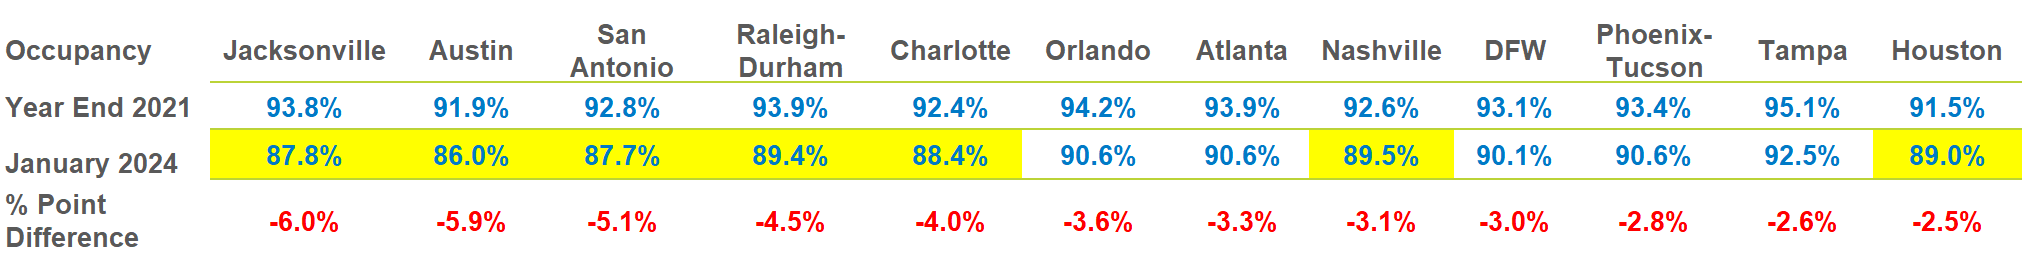
Figure A looks at occupancy levels at the end of 2021 and compares them to occupancy at the end of January 2024.
As 2021 ended, occupancy levels were near all-time highs driven by the spike in leasing activity from the economy reopening after COVID shutdowns. Occupancy levels in all metros fell throughout 2023 as move-outs from older, typically stable properties accelerated and new supply outpaced absorption or demand. Jacksonville suffered the largest drop in occupancy of the twelve metros listed below at -6.0 percentage points.
The magnitude of occupancy decline lessens as you move from left to right with Houston dropping only -2.5% from the highs of 2021 to the most current reading of 89.0%. The yellow highlights draw your attention to those markets whose overall average occupancy dropped below 90%, a threshold where a market transitions from a ‘Landlord Market’ to a ‘Renter Market’ and concessions increase.
Figure A – Occupancy Trend – Year-end 2021 compared to January 2024
In January, traditionally the end of the ‘slow leasing season,’ some markets stayed true to form and continued to experience decreasing occupancy, such as Jacksonville, Austin, Raleigh-Durham, Charlotte and DFW. Austin and Raleigh-Durham had the largest occupancy drop from December 2023 to January 2024 at 0.4 percentage points. The markets that were able to improve their occupancy levels in January 2024 were Tampa, Phoenix/Tucson, Nashville, Atlanta, and Orlando. Atlanta had the best occupancy improvement at 0.3 percentage points.
The forces pushing occupancy lower have been in place for many months. Move-outs in Classes B, C and D began in 2022 and continued through much of 2023. Residents seem to be moving out in protest of higher prices and lower value.
In addition, deliveries are outpacing demand or absorption. New construction deliveries in 2023, as well as in 2024, will be well above long-term averages due to the historic levels of new construction. These elevated deliveries are poorly timed as job growth is settling back to growth in the 2% to 3% range.
Figure B illustrates how the variance between “Units Delivered’ and ‘Units Absorbed’ in the past 12 months impacts occupancy in each metro area. In addition, the ‘Units Delivered as a Percentage of Overall Supply’ column is a weighted comparison of new supply in each metro. This approach provides a metric to analyze and compare the varied degrees of over-supply among the metro areas.
Figure B – New Units Delivered vs Absorbed as of December 2023
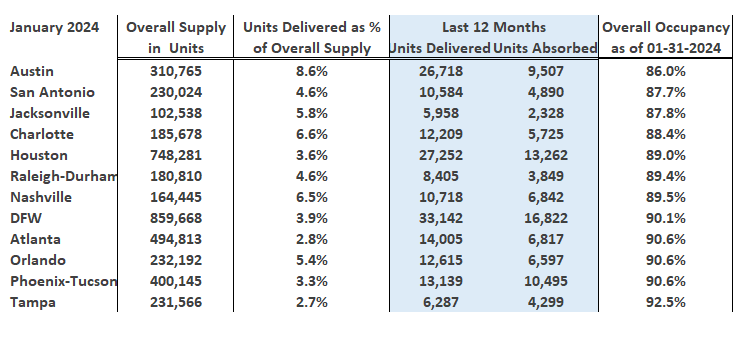
The metro order of Figure B is based on occupancy percentage from lowest to highest, placing Austin in the first position with the lowest occupancy. It becomes apparent that Austin’s low overall occupancy is a function of its large number of new units delivered (26,718) in relation to units absorbed. Also, Austin’s number of deliveries rivals that of Houston (27,252), a metro that is almost two and a half times larger than the size of Austin in terms of Overall Supply in Units. This illustrates the oversupply that is being experienced in Austin.
Further analysis shows that Austin’s new Units Delivered account for 8.6% of its overall supply, towering over the next closest metros, Charlotte at 6.6% and Nashville at 6.5%. Metros such as Austin, Charlotte and Nashville have historically operated in the range of 4.5% to 5.5% when it comes to new supply as a percentage of overall supply.
All metro markets on this table of data are experiencing varied degrees of supply difficulty. The good news is that the “fast leasing season” begins in February and continues through August. During this time, absorption will most likely outpace deliveries, providing an opportunity for occupancy to recover.
In addition, the issues of over-supply can be remedied with population and job growth. All these sunbelt metro markets are masters at generating corporate relocations and are leaders in economic development, the catalysts for growth.
Current rent growth
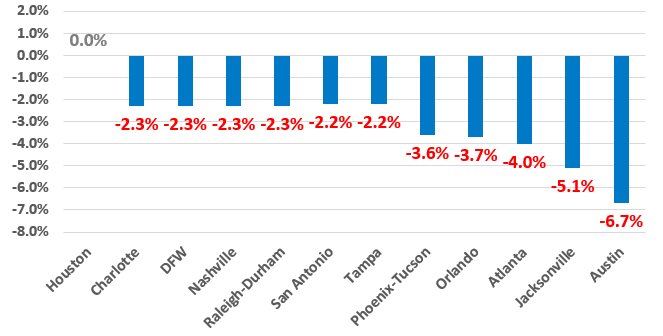
The lower occupancy performance discussed above places a strain on rent levels. Figure C shows that no markets were in positive territory as of the end of January. All markets realized lower rent growth through January.
Figure C – 12 Month Effective Rent Trend as of January 2024
Concessions become increasingly prevalent as occupancy levels falter and contribute more to the negative direction of rent growth.
Concessions are generally offered in one of three types of specials: months free, move-in, or floorplan. Each concession type lowers the market rent by some amount to arrive at an effective rent.
Figure D provides an analysis of the prevalence and magnitude of Class A concessions starting in October 2023 and continuing through January of 2024. The metro markets are sorted by the highest to lowest rent trends.
Though it appears first on the list, Houston shows an incremental increase in the percentage of Class A units offering a concession from October through January. Additionally, the magnitude of concessions being offered increased from -6.2% off-market in October 2023 to -7.2% in January 2024. This double-sided increase in concessions deteriorated rent levels and effectively lowered trends.
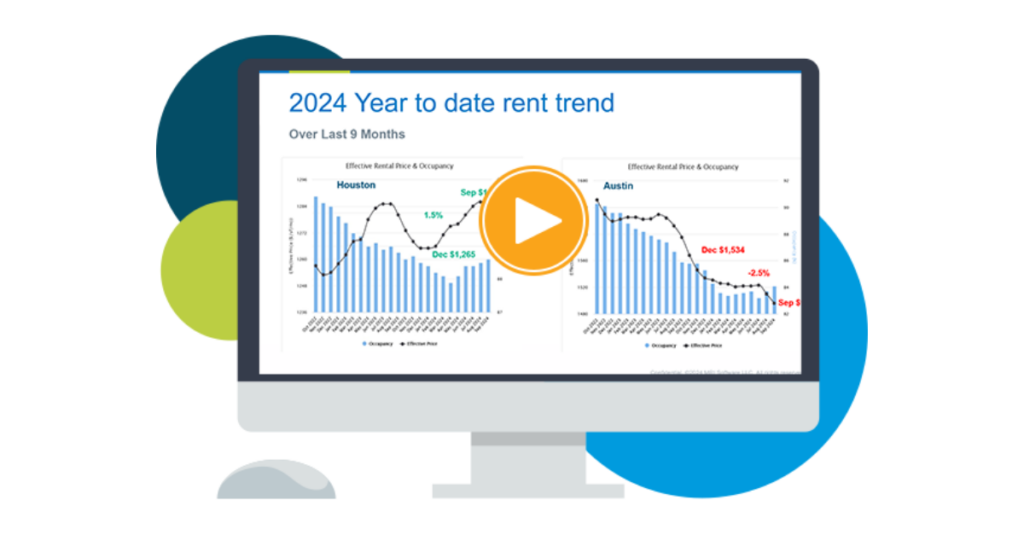
Houston’s 12-month trailing rent trend at the end of September, just prior to the concession increases in Figure D, was 2.2%, and now stands at 0.0%. Austin’s current rent, at the bottom of the twelve markets listed below, is -6.7%. At the end of September, Austin’s rent trend was -3.1%.
Figure D – Class A Concessions Analysis from October 2023 through January 2024

Concessions are likely to remain elevated. However, with the onset of the ‘fast leasing season,’ there may be a respite from expanding concessions as leasing velocity increases.
Wrapping up 2023 and looking forward to 2024
The curtain has closed on a difficult 2023 that featured excessive supply.
2024 will be another trying year with construction levels remaining high. The impact of these hefty new construction levels during 2024 will be considered poor timing as job growth is settling back to long-term averages of around 3.0 percent. This level of new units will keep a lid on Class A rent growth as concessions remain elevated.
There will be winners and losers on a property-by-property basis throughout 2024. Some properties will thrive, and experience rent growth of +3%, while others will struggle to realize rent growth of -3%. Many properties will find their rent growth all along the +3/-3 spectrum of rent growth extremes. These varied results set the stage for flat overall rent growth in 2024. Nevertheless, markets such as Austin, Jacksonville, and Atlanta may deviate from this forecast due to the negative rent trends they are experiencing at the onset of 2024.
Stay tuned as we continue this series with updated reporting on market conditions through the end of 2024.
Interested in learning more? View additional detail on rental rate, occupancy and absorption trends in our monthly Market Line Reports.
Multifamily market transitions: the changing dynamics of supply, demand, and financing
The multifamily market activity we’ve witnessed since the end of the global pandemic has become a familiar pattern of instability, characterized by extreme shifts in rental growth, supply levels, and absorption rates. Several factors, including the m…