Multifamily mid-year rental growth and occupancy update 2024
This report looks at overall occupancy levels and rental growth trends for 12 markets across Texas, Arizona, Georgia, Tennessee, North Carolina, and Florida.
June stands out as a pivotal month in the current supply-bubble cycle that all markets have been operating under for many months. Occupancy peaked around the end of 2021 and has since remained on a downward slide.
Initially, the occupancy decline was dominated by move-outs in the stable product classes of B, C, and D. The lower occupancy trend in these classes was relentless, free-falling as renters relocated to Single Family Rentals (SFR) in search of more affordable alternatives. In 2023, overwhelming amounts of new supply began to erode occupancy levels from Class A, the top of the Class/Price structure, as new unit deliveries outpaced absorption or demand driven by reasonably strong job growth. Demand weakness in all classes of properties adds a unique and puzzling piece when assessing market conditions.
Though it was expected to materialize in March, the “fast leasing season” finally arrived in June.
Occupancy results were very mixed among the 12 metro markets we cover. Some markets moved the occupancy needle higher while other markets could not budge due to the unrelenting amounts of new supply outpacing absorption.
Looking back, rent levels peaked in the middle of 2022. Since then, two routes of downward rent movement have been established.
One route is a consistently falling rent level from the 2022 peak with multiple plateaus along the way down. Markets such as Phoenix-Tucson, Jacksonville, Atlanta, and Austin fall into this travel group. These markets experienced larger rent declines than those on the second route of movement where rent levels fell from 2022’s peak but reached another similar peak in the middle of 2023. “Twin peaks” would be an apt description of the profile for this group’s rent movement.
Since the middle of 2023 or from the second peak, rent levels have dropped. Markets such as Orlando, Tampa, Charlotte, Raleigh-Durham, Nashville, DFW, and San Antonio make up the group of markets that experienced “twin peaks” of rent levels on their downward rent route. One significant commonality for these groups is that the rent level for each market is currently lower than the 2022 peak. Houston is the exception with rent levels that are currently higher than in 2022 but slightly lower than mid-year 2023.
Read on for more discussion on how occupancy and rent levels are responding to this seasonally late, mild market strength.
Occupancy
Figure A displays the overall occupancy levels at year-end 2021 (the top row of data) which represent historic highs advanced by the reopening economy after pandemic closures in 2020.
The second row of data shows the occupancy levels at year-end 2023 as Class A oversupply and the stable class move-outs, discussed above, lowered occupancy levels from the highs of 2021. The third row indicates the percentage point difference in occupancy between the year-end levels of 2021 and 2023.
The position of markets in this table is determined by the magnitude of percentage point decline with the market having the highest decline, Jacksonville, listed first and Houston, having the smallest decline, appearing last.
Figure A. Occupancy analysis – Year-end 2021 / Year-end 2023 / June 2024

The fourth row of Figure A shows the latest occupancy for June 2024 and the bottom row indicates the percentage point difference between year-end 2023 and June 2024. Here, the numbers shown in green highlight those markets that added occupancy this year, finally reversing the downward movement and pressure that dominated all markets since 2021.
Jacksonville is the best occupancy performer during the first six months of 2024 and the worst performer since 2021. Other markets that increased occupancy this year are Orlando, Charlotte, Raleigh-Durham, and Nashville.
Markets that are still struggling with supply/demand issues are listed in red font, having lower occupancy levels through the first six months of 2024. Austin dropped by 0.9 percentage points this year while DFW, Tampa, San Antonio, and Atlanta experienced even lower occupancy levels. Occupancy for Houston and Phoenix-Tucson have remained flat in 2024.
Scanning across the June 2024 row of current overall occupancy reveals a consistent pattern of occupancy levels falling below 90%. Only Tampa, at 91.0%, and Orlando, at 90.9%, are above 90%, a threshold where a “landlord’s market” becomes a “renter’s market” and concessions are more prevalent.
Rent trends
The markets with the greatest occupancy decline, shown in Figure A, are under the most distress from the supply/demand issues plaguing all markets. Occupancy distress, or magnitude of occupancy decline, directly correlates to the magnitude of negative rent trend. As a result, the markets with the highest occupancy decline will most likely have the most negative rent trends and, consequently, the most concessions.
Figure B shows the 12-month or year-over-year rent trend for the 12 metros we cover. All markets are in the red or negative territory due to weak occupancy levels.
Figure B. 12-month effective rent trend as of June 2024

Properties typically lower prices to attract more prospects and improve occupancy. While market price adjustment is the more common approach, concessions are another strategy that properties use to drive traffic. Class A lease-ups primarily use concessions, putting competitive pressure on all Class A products in the market.
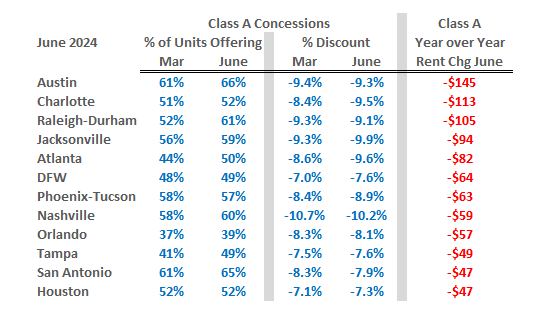
Figure C shows Class A concessions as the percentage of units offering such inducements and the discount expressed as a percentage off the market or street price. The timeframe analyzed is between March and June of this year. The sort order of the markets is determined by the data in the last column, which lists in descending order the differences between current Class A rates and those from a year ago.
The percentage of Class A units offering a concession increased in all metros from March to June except for Phoenix-Tucson, which declined one percentage point from 58% to 57%, and Houston, which remained the same at 52%. Raleigh-Durham had the largest increase, rising from 52% in March to 61% in June. Atlanta is worthy of dubious mention, having a six percentage point increase, from 44% to 50%, combined with a one percentage point increase in the level of discount.
Although Atlanta had notable increases, the year-over-year decrease in Class A rent levels of $82 pales in comparison to Austin’s decrease of $145 in Class A rent over the last year. Austin currently has 66% of its Class A units offering a concession, reducing market rent by 9.3%. As a reference point, a one-month free concession equals 8.3%.
Figure C. Class A concessions analysis June 2024

Concessions are likely to remain elevated for the remainder of the year as the puny “fast leasing season” fades and substantial amounts of supply are still to be delivered.
Prospects for 2024
Up until now, the 12-month year-over-year rent trend has been a dreadful gauge to watch. With half of 2024 in the books, it is appropriate to look at the 6-month annualized rent trend to speculate how the year will end. Figure D compares the 6- and 12-month rent trends by metro and adds in units under construction. The metro markets are sorted in ascending order by the 6-month rent trend, from worst to best. Austin has the worst trend at -2.1% and Nashville has the best at 4.0%.
The 6-month trend looks drastically better than the 12-month trend.
There are some data series and calculation issues to consider when comparing these measures. The 12-month trend has six months’ worth of 2023 data points as part of its calculation, dragging the trends downward.
The 6-month trend only has data points from 2024, but the trends are annualized. This means that the actual trend value for the first six months of 2024 is multiplied by two to arrive at the annualized trend. This treatment assumes that the same trend that occurred over the first six months will continue for the next six months. While this is unlikely, focusing on this trend at mid-year provides a basis to determine which markets have turned positive, listed in green font, and those that remain less negative, shown in red.
One reason that the 6-month rent trend values will not hold and will likely drop by year-end is market cyclicality. The approaching “slow leasing season” begins in September and ends in January, when absorption or demand is noticeably lower.
Figure D. 6-month and 12-month rent trends plus units under construction

Another reason that rent trends will not be as strong as those shown in Figure D is the substantial number of units in the under-construction pipeline. Many under construction units in Figure D will deliver during the remainder of 2024. Those deliveries, coupled with anticipated slowing demand/absorption, do not create conditions for increased market strength in the near future.
That’s the bad news. The good news is that ten of the 12 markets shown in Figure D have realized positive rent growth over the first six months of 2024. Nashville, Orlando, Houston, Charlotte, and Jacksonville have the best chances of realizing positive rent growth this year.
Raleigh-Durham, Tampa, Phoenix-Tucson, Atlanta, and San Antonio are markets that look to attain flat rent growth this year based on their six-month position. The prospects for attaining positive rent growth this year are dim for Austin and DFW.
Stay tuned as we continue this series with updated reporting on market conditions throughout the remainder of 2024.
Interested in learning more? View additional detail on rental rate, occupancy, and absorption trends in our monthly Market Line Reports.
Multifamily market transitions: the changing dynamics of supply, demand, and financing
The multifamily market activity we’ve witnessed since the end of the global pandemic has become a familiar pattern of instability, characterized by extreme shifts in rental growth, supply levels, and absorption rates. Several factors, including the m…
