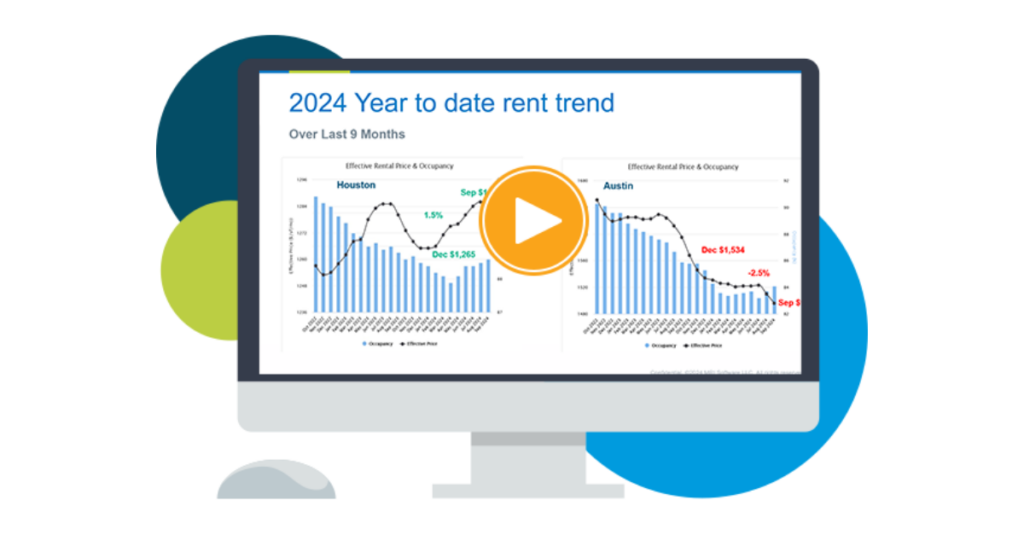
Multifamily rental growth update through September 2023
This analysis looks at current rental growth trends for twelve markets across Texas, Arizona, Georgia, Tennessee, North Carolina, and Florida.
Occupancy
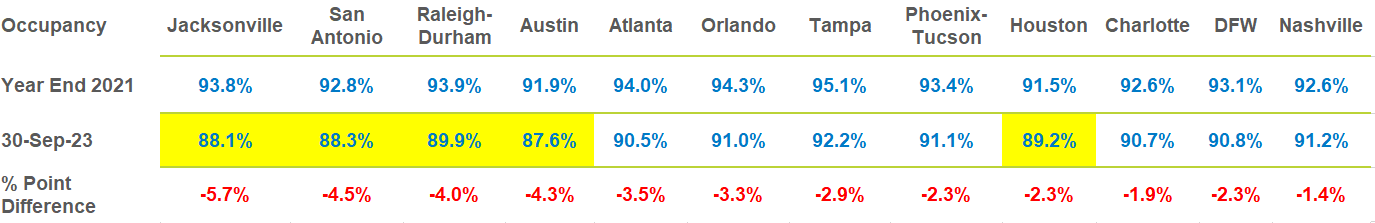
September renewed the slide in occupancy levels in all markets except in San Antonio, where occupancy improved by a miniscule 10 basis points, and in Phoenix-Tucson, where occupancy moved ahead by 50 points. Jacksonville now has the dubious distinction of having the largest occupancy drop of the twelve metros listed in Figure A, at 5.7%. The magnitude of occupancy decline lessens as you move from left to right on the graph, with Nashville holding its drop to 1.4 percentage points from the highs of 2021 to the most current reading of 91.2% at the end of September 2023. The yellow highlights draw attention to those metros with an average occupancy dropping below 90%, a threshold that has historically been the point at which a market transitions from a ‘Landlord Market’ to a ‘Renter Market.’
Figure A – Occupancy Trend – Year-end 2021 through September 2023
The forces driving occupancy down have been in place for many months now. Deliveries are outpacing demand. New construction deliveries in 2023, as well as in the coming years of 2024 and 2025, will be greater than the best year of deliveries since the Great Financial Crisis, or since 2010. These elevated delivery levels are poorly timed, as job growth is settling back to a long-term average growth in the 2% to 3% range.
The additional demand that multifamily lease-ups once enjoyed from home buyers who became renters due to high mortgage rates has faded. Home builders have reclaimed such demand by buying-down mortgage rates to a sweet spot of 5%.
Another factor leading to the erosion of occupancy levels in all markets is inexplicable move-outs from Classes B, C and D. Prior to 2022, these classes behaved in a very stable manner. Higher prices for these product levels could explain the anecdotal scenarios of ‘doubling-up,’ or moving back in with relatives. However, there is a bigger, more concerning supply/demand paradigm shift to Single Family Rentals (SFR’s) that has occurred, attracting renters from professionally managed apartments to this growing SFR Shadow Market.
Current rent growth
Lower occupancy puts rent levels under pressure. Figure B shows two dimensions of rent: one is the annual or 12-month trailing trend by metro, and the second is the nominal change in overall average rent from August to September.
The annual trend statistics, appearing at the bottom of each metro bar, depict a general improvement in rent growth. Ten of the twelve markets, as of the end of September, had shifted their trends in a more positive direction. Austin’s rent trend at the end of August was -3.4% and is now -3.1%. Another example of improvement is found in Raleigh-Durham where the previous rent trend was 0.4% and is now 1.0%. The two exceptions for improvement were in Orlando and Jacksonville, where rent trends moved fractionally more negative.
Figure B – 12 Month Rent Trend as of September 2023
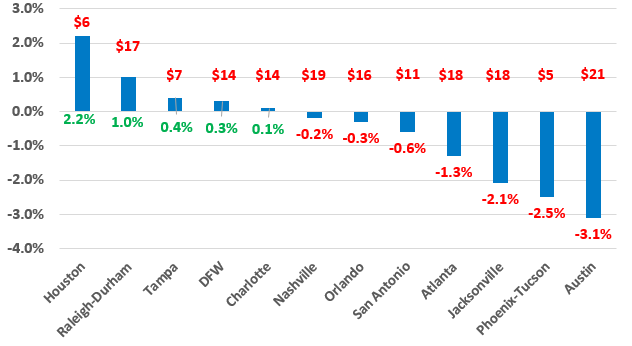
The overall movement in annual trend statistics is proving to be a false-positive situation, as every market’s average rent level decreased from August to September by the dollar amounts shown at the top of each metro bar. The changing of the data series for calculating trends produced this aberration. The current movement in rent levels is a more important measure of market conditions than activity from 12 months ago.
What this means for 2023 and 2024
2023 continues to be a challenging year as supply and demand issues persist. These markets are running out of time to show any significant occupancy or rent improvements for 2023, particularly as we enter the end-of-year seasonal slowness that typically drags on through January.
2024 is shaping up to be another challenging year with construction levels reaching numbers that are historically significant. These hefty new construction levels will impact the remainder of 2023 through 2024, which will be considered poor timing, as job growth is settling back into long-term averages. The rising level of new units will keep a lid on Class A rent growth as concessions increase in quantity and magnitude.
A big question mark concerning the direction of 2024’s performance is whether move-outs will continue to persist, or if they will ease to allow occupancy in Class B, C and D product to improve.
If the SFR rental market continues its growth, 2024 will look very similar to 2023 when a flat rental trend performance was considered a win.
Stay tuned as we continue this series with updated reporting on market conditions for 2023.
Interested in learning more? View additional detail on rental rate, occupancy and absorption trends in our monthly Market Line Reports.
Multifamily market transitions: the changing dynamics of supply, demand, and financing
The multifamily market activity we’ve witnessed since the end of the global pandemic has become a familiar pattern of instability, characterized by extreme shifts in rental growth, supply levels, and absorption rates. Several factors, including the m…