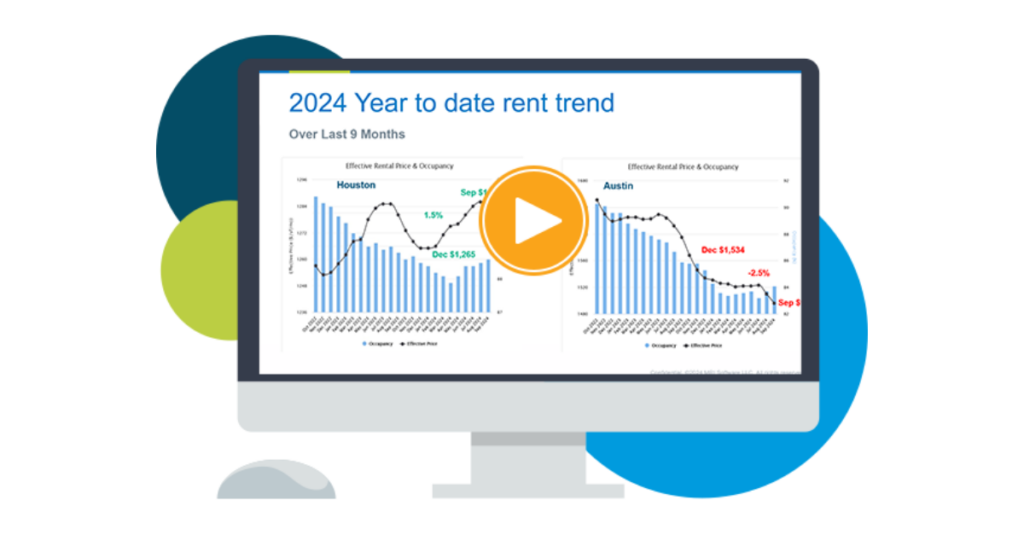
Multifamily rental growth update through November 2023
This analysis looks at overall occupancy levels and rental growth trends for twelve markets across Texas, Arizona, Georgia, Tennessee, North Carolina, and Florida.
Occupancy
Seasonal slowness is well underway and impacting November occupancy levels in all metro areas. On top of that, new construction deliveries are outpacing absorption and keeping a lid on occupancy.
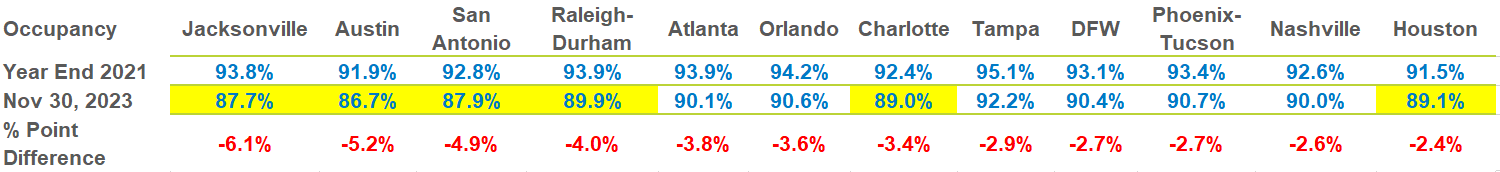
Jacksonville suffered the largest drop in occupancy of the twelve metros listed below at 6.1%. The magnitude of occupancy decline lessens as you move from left to right on Figure A below with Houston dropping only 2.4% from the highs of 2021 to the most current reading of 89.1%. The yellow highlights draw your attention to those markets whose overall average occupancy dropped below 90%, a threshold known as the point where a market transitions from a ‘Landlord Market’ to a ‘Renter Market’ and concessions prevail.
Figure A – Occupancy Trend – Year-end 2021 through November 2023
The forces pushing occupancy lower have been in place for many months now. Move-outs in Classes B, C and D began in 2022 and continued through much of 2023. In addition, deliveries are outpacing demand or absorption. New construction deliveries in 2023, as well as in 2024, will be greater than the best year of deliveries since the Great Financial Crisis, or since 2010. These elevated deliveries are poorly timed as job growth is settling back to long-term average growth in the 2% to 3% range.
Figure B illustrates the size and direct impact on occupancy created by the difference between “Units Delivered” and “Units Absorbed” in each metro area.
Figure B – New Units Delivered vs Absorbed as of November 2023
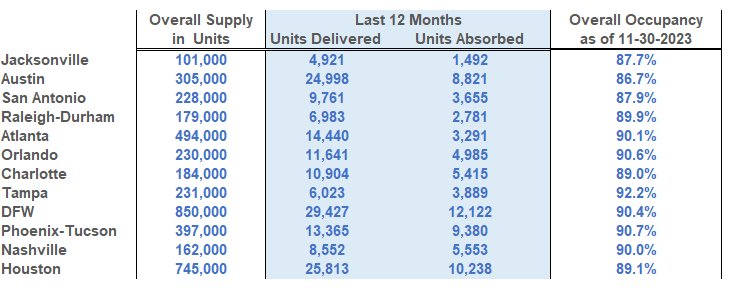
The metro order of Figure B corresponds with Figure A, which is based on the largest occupancy decline since year end 2021, when most metro areas’ occupancies peaked with the economic reopening. Over the last 12 months, Jacksonville lost 3.4% of occupancy due to the imbalance between units delivered and units absorbed. Houston experienced an occupancy decline of 2.0% over the last twelve months due to the disparity between units delivered and units absorbed.
Current rent growth
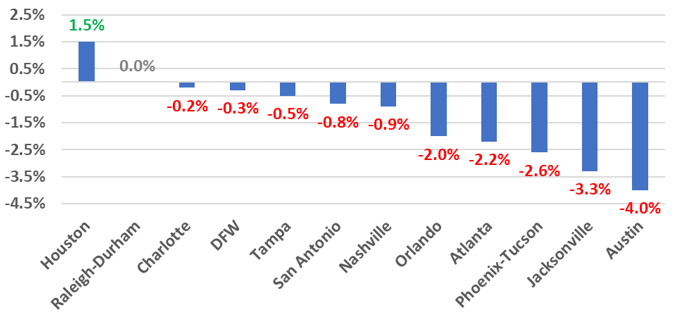
Lower occupancy puts rent levels under pressure. As of the end of November, 10 of the 12 markets we serve, represented in Figure C, experienced negative rent growth over the last 12 months. Raleigh-Durham realized a flat rent trend and Houston’s rent growth continues to outpace all other markets at 1.5%. All markets realized lower rent growth through November.
Figure C – 12 Month Effective Rent Trend as of November 2023
As occupancy levels stall, concessions become more prevalent and increasingly contribute to the negative direction of rent growth.
Concessions are generally offered in one of three types of specials: move-in, months free, or floorplan. Each concession type lowers the market rent by some percentage to arrive at a reduced effective rent.
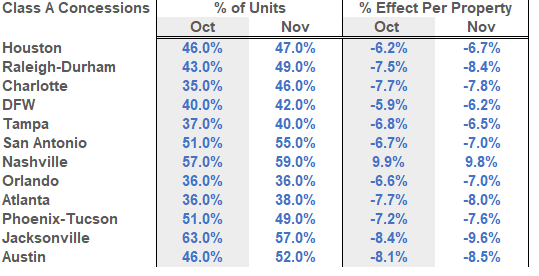
Figure D provides an analysis of the prevalence and magnitude of Class A concessions between October and November. There were more Houston Class A units offering concessions in November at 47%, than in October at 46%. Additionally, the level of concessions being offered increased from -6.2% off-market to -6.7%. When more properties offer larger concessions, overall rent trends decrease.
Figure D – Class A Concessions Analysis
What this means for 2023 and 2024
2023 continues to be a challenging year as supply and demand issues persist. With only one month left in the year, rent growth will not change significantly from the values found in Figure C, and will most likely drop, as December is traditionally the slowest traffic month of all.
2024 is shaping up to be another difficult year with construction levels reaching historic highs. The impact of these hefty new construction levels will be spread over 2023 and 2024, which will be considered poor timing as job growth is settling back to long-term averages of around 3.0 percent. This level of new units will keep a lid on Class A rent growth as concessions increase in quantity and magnitude.
A big question mark concerning the direction of 2024’s performance is whether move-outs will continue to persist, or if they will ease to allow occupancy of Class B, C and D product to improve. This unusual phenomenon of stabilized product move-outs began late in 2021 and has become a steady drain on occupancy.
If the SFR rental market continues its growth, 2024 will look very similar to 2023 when a flat rental trend performance was considered a win.
Stay tuned as we continue this series with updated reporting on market conditions into 2024.
Interested in learning more? View additional detail on rental rate, occupancy and absorption trends in our monthly Market Line Reports.
Multifamily market transitions: the changing dynamics of supply, demand, and financing
The multifamily market activity we’ve witnessed since the end of the global pandemic has become a familiar pattern of instability, characterized by extreme shifts in rental growth, supply levels, and absorption rates. Several factors, including the m…