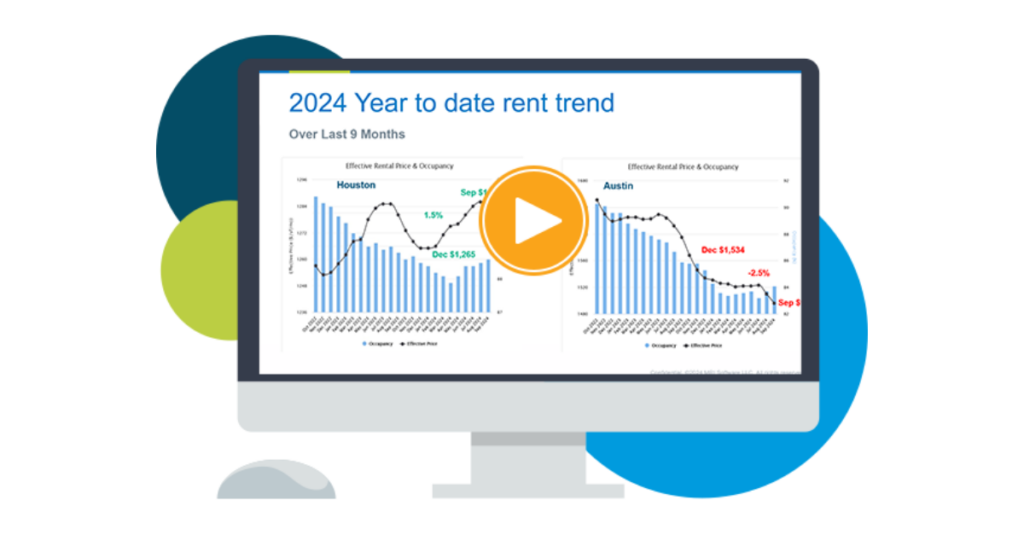
Multifamily rental growth update through August 2023
This analysis looks at current rental growth trends for twelve markets across Texas, Arizona, Georgia, Tennessee, North Carolina, and Florida.
Occupancy
August provided a lift in occupancy levels in all markets, reversing a persistent trend that had been decreasing occupancy since the end of 2021. San Antonio sustained the largest drop of the twelve metros listed below at 4.6 percentage points. The magnitude of occupancy decline lessens as you move from left to right on Figure A below with Nashville dropping only 0.9 percentage points from the highs of 2021 to the most current reading of 91.7%.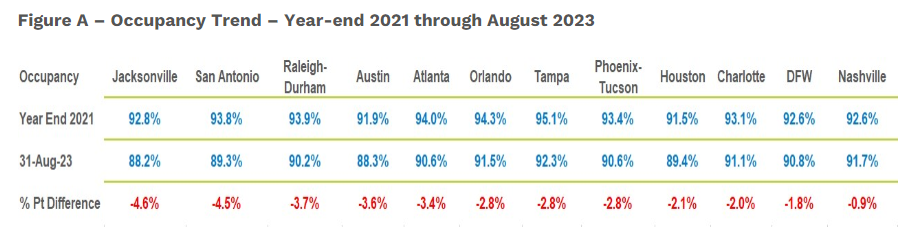
The dynamics behind this movement toward lower occupancy are driven by a steady and strong delivery of new construction units with an absorption response insufficient to cover the level of new units. In addition, a long-running scenario of increased net move-outs in all classes of stabilized product has mystified market watchers who wonder where these residents are going.
Figures B and C illustrate the relationship between new construction units delivered and Class A absorption, and amass the negative absorption of Classes B, C and D over the last 12 months. In addition, current units under construction are presented to shed light on the massive amount of new supply expected to be delivered over the next two years.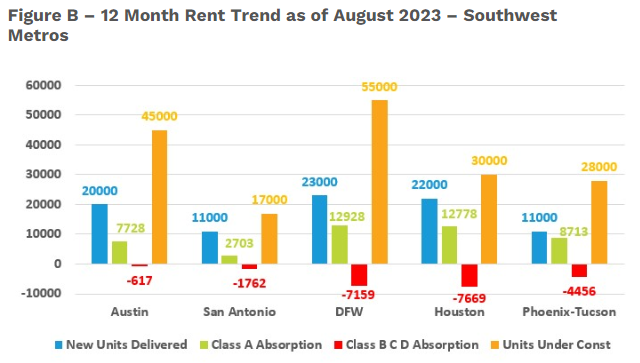
Figure B depicts Southwestern Metro Markets with the blue bars representing total new units delivered over the last twelve months and the green bars indicating the Class A units absorbed over the same timeframe. Differences in these numbers, within each metro, lower the occupancy rate and apply increased concession pressure to the greater differences.
The red bars stand for the aggregate negative absorption of Classes B, C and D, which create an additional drain on a metro area’s occupancy level. The blue, green and red bars clarify the dynamics behind the drop in occupancy shown in the occupancy table above. The orange bars show the number of units presently under construction and all instances represent levels two to three times the long-term average of construction.
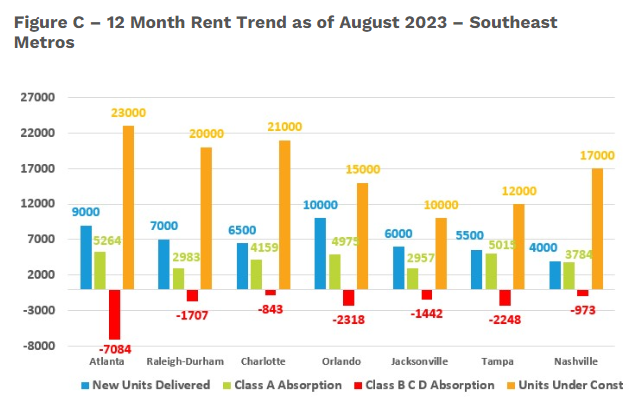
Figure C presents the same elements shown in Figure B for the Southeast Metro Markets. As with the Southwest Markets, the Southeast is exhibiting similar behavior with new units delivered, in blue, outpacing Class A absorption, in green, and an exodus from stabilized Class B, C and D represented in red. Units presently under construction, in orange, are just as plentiful as in the Southwest, reaching levels that raise concerns for orderly deliveries in 2024 and 2025.
Current rent growth
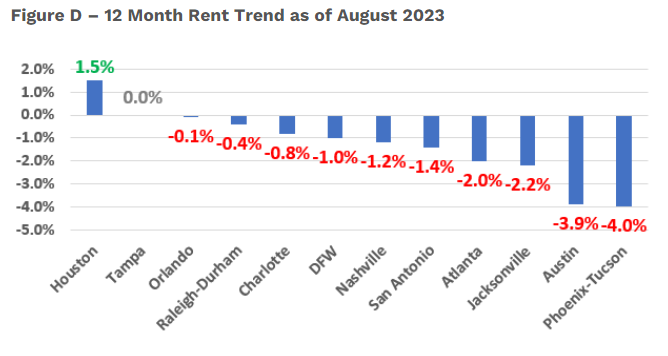
Lower occupancy puts rent levels under pressure. As of the end of August, eight of the 12 markets we cover are experiencing negative rent growth over the last twelve months. Tampa, Orlando, and Raleigh-Durham pushed their trend performance into positive territory in August. Houston continues to build its annual rent growth to 1.8%. All markets currently in the red made progress in August by moving rents in a more positive direction.
What this means for 2023
2023 continues to be a challenging year as supply and demand issues persist. All metros are running out of runway to have any rent trend lift in 2023. September typically ushers in a seasonal slowdown that lasts through January. Rent levels will improve slightly; excluding Houston, Austin, and Phoenix-Tucson, look for rent trends to end the year in the range of 1.0% to -1.0%.
2024 is shaping up to be another challenging year with construction levels reaching historic highs. The impact of these hefty new construction levels will be spread over 2023 and 2024, which will be considered poor timing as job growth is settling back to long-term averages of around 3.0 percent. This level of new units will keep a lid on Class A rent growth as concessions increase in quantity and magnitude.
A big question mark concerning the direction of 2024’s performance is whether move-outs will continue to persist, or if they will ease to allow occupancy of Class B, C and D product to improve. This mystifying phenomenon of stabilized product move-outs began late in 2021 and has become a steady drain on occupancy.
Where are these residents going? Anecdotally, the move-outs have been attributable to ‘doubling up’ and moving in with relatives or moving to ‘shadow market’ rentals. Until recently, I had no idea how to describe or quantify this ‘shadow market’. After numerous online searches, I found an article that explains where these move-outs are going. The most interesting finding was the increase in corporate ownership of single-family home rentals and purchases by buyers owning five or more properties. According to the article, single-family rentals (SFR) have become a serious and sizeable alternative to professionally managed apartment communities.
If the SFR rental market continues its growth, 2024 will look very similar to 2023 when a flat rental trend performance was considered a win.
Stay tuned as we continue this series with updated reporting on market conditions for 2023.
Interested in learning more? View additional detail on rental rate, occupancy and absorption trends in our monthly Market Line Reports.
Multifamily market transitions: the changing dynamics of supply, demand, and financing
The multifamily market activity we’ve witnessed since the end of the global pandemic has become a familiar pattern of instability, characterized by extreme shifts in rental growth, supply levels, and absorption rates. Several factors, including the m…