Multifamily rental growth and occupancy update February 2024
This report looks at overall occupancy levels and rental growth trends for twelve markets across Texas, Arizona, Georgia, Tennessee, North Carolina, and Florida.
Hopes were high that February would bring an early start to the ‘fast leasing season’ and provide some occupancy recovery; however, February was fickle as new construction deliveries continued to overwhelm absorption in two thirds of the markets we serve.
The two main factors that hampered market conditions throughout 2023 remain present.
New construction deliveries have skyrocketed to a 40-year high. As supply surges, demand or job growth is settling, moving lower from the historic highs recorded during the economic reopening in 2021. Even though job growth, the engine that drives absorption, is decent, it is moving in the opposite direction of supply. The combined increase in supply and decrease in job growth is not conducive to the development of stronger fundamentals.
Read on for more discussion on how occupancy and rent levels are responding to this less-than-positive setup.
Occupancy
Figure A compares occupancy levels at the end of 2021 to those at the close of February 2024. As 2021 ended, occupancy levels were near all-time highs driven by the spike in leasing activity from the economy reopening after COVID shutdowns. Occupancy levels in all metros fell throughout 2023 as move-outs from older, typically stable properties accelerated and new supply outpaced absorption or demand.
Austin now claims the largest drop in occupancy of the twelve metros listed below at -7.1 percentage points. San Antonio has the second largest decline in occupancy at -5.9 percentage points. These two metro markets are likely to hold their dubious positions throughout 2024 as they work down large quantities of under-construction units.
The magnitude of occupancy decline lessens as you move from left to right with Phoenix-Tucson dropping only -2.8 percentage points from the highs of 2021 to the most current reading of 90.6%. The yellow highlights draw your attention to those markets whose overall average occupancy remains above 90%, a threshold where a market transitions from a ‘Landlord Market’ to a ‘Renter Market’ and concessions increase.
Of the 12 markets we serve, only four are holding occupancy levels higher than 90 percent: Orlando at 90.4%; Atlanta at 90.1%; Tampa at 92.1%; and Phoenix-Tucson at 90.6%.
February’s tradition of starting the ‘fast leasing season’ did not materialize this year; instead, it was another month in which occupancy levels fell in eight of the 12 markets and leasing could not keep pace with new units delivered.
Jacksonville and Nashville were the only markets to show improved occupancy. Jacksonville improved by 0.3 percentage points while Nashville went up 0.1 percentage point.
Occupancy in Charlotte and Phoenix-Tucson remained the same from January to February.
In summary, occupancy decreased in eight markets, improved in two markets, and remained flat in two markets.
Figure A – Occupancy Analysis – Year-end 2021 compared to February 2024

A Stable Overall Occupancy line has been added to Figure A. Stable occupancy is calculated by removing the properties that are in lease-up from the overall occupancy calculation. This exercise provides insight into the strength of market conditions. As occupancy has continually decreased since 2021, occupancy of the existing, stable product has fallen as well, due to the Shadow Market disruption of Single-Family Rentals (SFR’s). Monitoring the Stabilized Occupancy statistic throughout 2024 will be crucial in determining whether Shadow Market disruption persists.
As mentioned above, deliveries are outpacing demand or absorption. New construction deliveries in 2024 will be well above long-term averages due to the historic levels of new construction.
Figure B illustrates how the variance between ‘Units Delivered’ and ‘Units Absorbed’ in the past 12 months impacts occupancy in each metro area. In addition, ‘Units Delivered as a Percentage of Overall Supply’ column is a weighted comparison of new supply in each metro. This approach provides a metric to analyze and compare the varied degrees of over-supply among the metro areas.
Figure B – Supply, New Units Delivered, and Absorption Analysis

The metro order of Figure B is based on occupancy percentage from lowest to highest, placing Austin in the first position with the lowest occupancy. It becomes apparent that Austin’s low overall occupancy is a function of its large number of new units delivered (31,193). This number of deliveries surpasses that of Houston (28,643), a metro that is almost two and a half times larger than the size of Austin in terms of Overall Supply in Units.
Further analysis shows that Austin’s new Units Delivered account for 9.9% of its Overall Supply, towering over the next closest metros, Nashville at 6.2% and Charlotte at 6.1%. Metros such as Austin, Charlotte, and Nashville have historically operated in the range of 4.5% to 5.5% when it comes to new supply as a percentage of overall supply.
All metro markets on this data table are experiencing varied degrees of supply difficulty. Hopefully, the expected ‘fast leasing season’ will begin in March and continue through August. During this time, absorption will most likely outpace deliveries, providing an opportunity for occupancy to recover.
Additionally, the issues of over-supply can be remedied with population and job growth. All these sunbelt metro markets are masters at generating corporate relocations and are leaders in economic development, the catalysts for growth.
Current rent growth
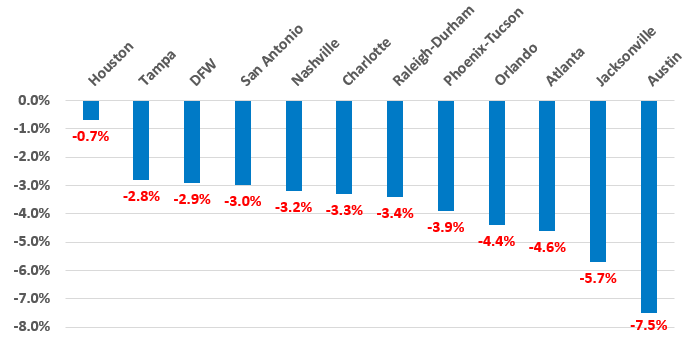
The lower occupancy performance discussed above places a strain on rent levels. Figure C shows that no markets were in positive territory as of the end of February. All markets realized significantly lower rent growth in February.
Figure C – 12 Month Effective Rent Trend as of February 2024
Concessions become increasingly prevalent as occupancy levels weaken and contribute more to the negative direction of rent growth.
Concessions are generally offered in one of three types of specials: months free, move-in, or floorplan. Each concession type lowers the market rent by some amount to arrive at an effective rent.
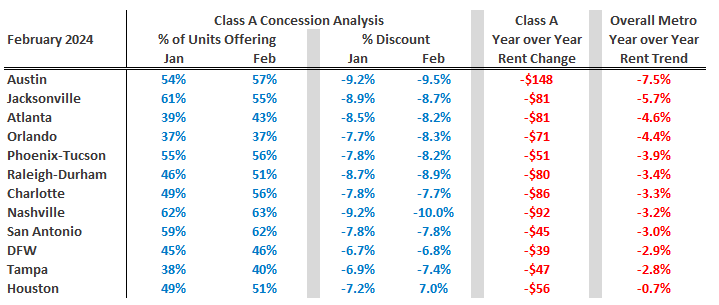
Figure D provides an analysis of the prevalence and magnitude of Class A concessions for the first two months of this year. The metro markets are organized from the worst rent trends to the best.
In Austin, which experienced the worst rent trend, there was a three-percentage point increase in the number of Class A units offering a concession from January to February. Additionally, the magnitude of concessions being offered increased from -9.2% off-market in January to -9.5% in February. This double-sided increase in concessions deteriorated rent levels, effectively lowering trends for Austin to -7.5%. This effect has caused Austin’s Class A rents to decrease by $148 over the last 12 months.
Houston, with the best Overall Metro Year over Year Rent Trend at -0.7%, had a two-percentage point increase in the number of units offering a concession, as well as a 0.2% decrease in the effect of concessions. Nashville is noteworthy for its percentage discount having reached negative 10.0%.
Figure D – Class A Concessions Analysis February 2024
Concessions are likely to remain elevated. However, with the onset of the ‘fast leasing season,’ there may be a respite from expanding concessions as leasing velocity increases.
Prospects for 2024
2023 is in the rear-view mirror but the conditions that made it a difficult year remain present.
Unfortunately, 2024 will be much like 2023. Construction levels will remain high. Absorption will be challenged to keep pace with deliveries. Considering the level of rent trends shown in Figure C, it has become increasingly difficult to find a narrative that forecasts a positive rent trend performance in any market.
For prospects to begin to improve this year, March needs to go “out like a lion” with leases, to paraphrase a song from the Broadway show, Carousel. A leasing revival needs to materialize for the forthcoming ‘fast leasing season,’ as February was a bust with declining occupancy and rent levels.
Stay tuned as we continue this series with updated reporting on market conditions through the end of 2024.
Interested in learning more? View additional detail on rental rate, occupancy and absorption trends in our monthly Market Line Reports.
Multifamily market transitions: the changing dynamics of supply, demand, and financing
The multifamily market activity we’ve witnessed since the end of the global pandemic has become a familiar pattern of instability, characterized by extreme shifts in rental growth, supply levels, and absorption rates. Several factors, including the m…