How to calculate capture rate for retail stores
The issue raised most frequently with us by our retailer clients is whether sales in their bricks and mortar stores are as good as they could be.
Valuable insights can be gained from tracking store sales against market performance, which is why the MRI Software retail foot traffic data has been so widely adopted by the industry, media, academia, and the government. With a correlation of 78% between store sales and footfall in UK retail destinations, there is no denying that footfall is a key contributor to store success.
Of course, having accurate data on footfall from the street into the store is also critical, as this makes it possible to calculate retail conversion rate, which is a key performance metric. However, what is lacking here is context; the success of the store relative to its location.
Is the store capturing as much trade as it could be in that town or shopping center, or is it underperforming? The key to this is identifying the store’s Capture Rate.
What is capture rate?
A store’s Capture Rate is the percentage of footfall in the street or mall that enters a store and represents a store’s market share in a location. It establishes how a store is faring relative to its location and whether its trading potential in that location is being maximized. The optimal situation for a store is for its Capture Rate to be increasing – for it to be growing its market share, which of course is the lifeblood of any business.
How to calculate capture rate
If you’re wondering – how do I measure capture rate for retail stores? The following capture rate formula will help.
Capture Rate = ([# of People Entered Store] ÷ [# of People Who Neared Store Entrance]) * 100
Measuring the number of people who neared your store’s entrance (whether or not they entered) is usually the complicated part. Footfall counter software can typically be configured to monitor the area outside your store’s entrance. This allows you to gather data on the formula’s denominator – the pool of potential entrants. You can then configure a virtual boundary within the software to qualify when someone has officially entered your store.
The Capture Rate is crucial from two perspectives. Firstly the rate itself is a very telling measure of the success of individual stores. Secondly, the trend in a store’s Capture Rate over time indicates whether a store’s performance is improving, staying stable, or diminishing.
If you find a particular location’s performance slipping, but retail capture rates remain strong – you have identified that the problem is not necessarily your staff. The property owner may not be delivering the foot traffic you had expected. As a retail tenant, it is not entirely your responsibility to determine how to increase footfall in a shopping mall. This could help the larger retail brand with future location planning, and it could help renegotiate lease terms.
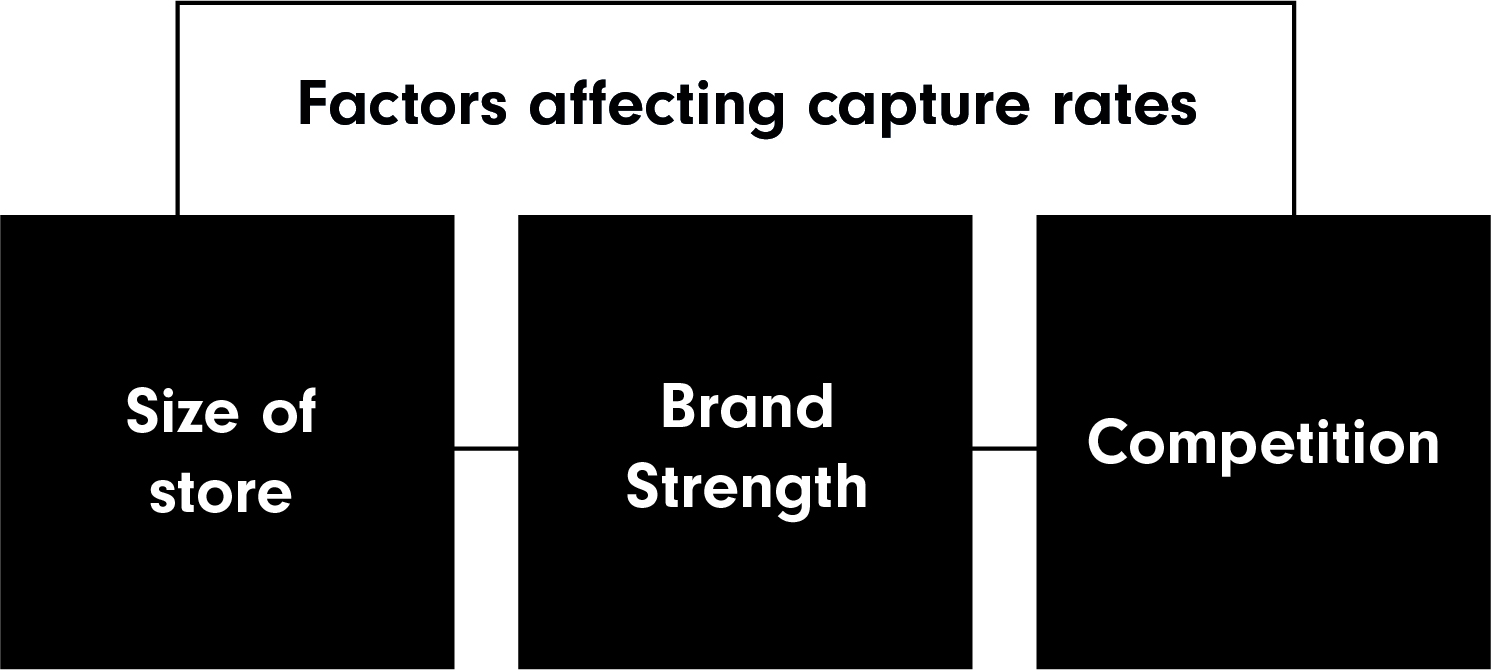
Turning firstly to the Capture Rate itself, Capture Rates reflect a combination of three factors – the breadth of offer, brand strength, and competition – and the influence of each of these factors varies across different types of retailers. Stores with the greatest breadth of offer and brand strength with the lowest amount of competition will have the highest Capture Rates.
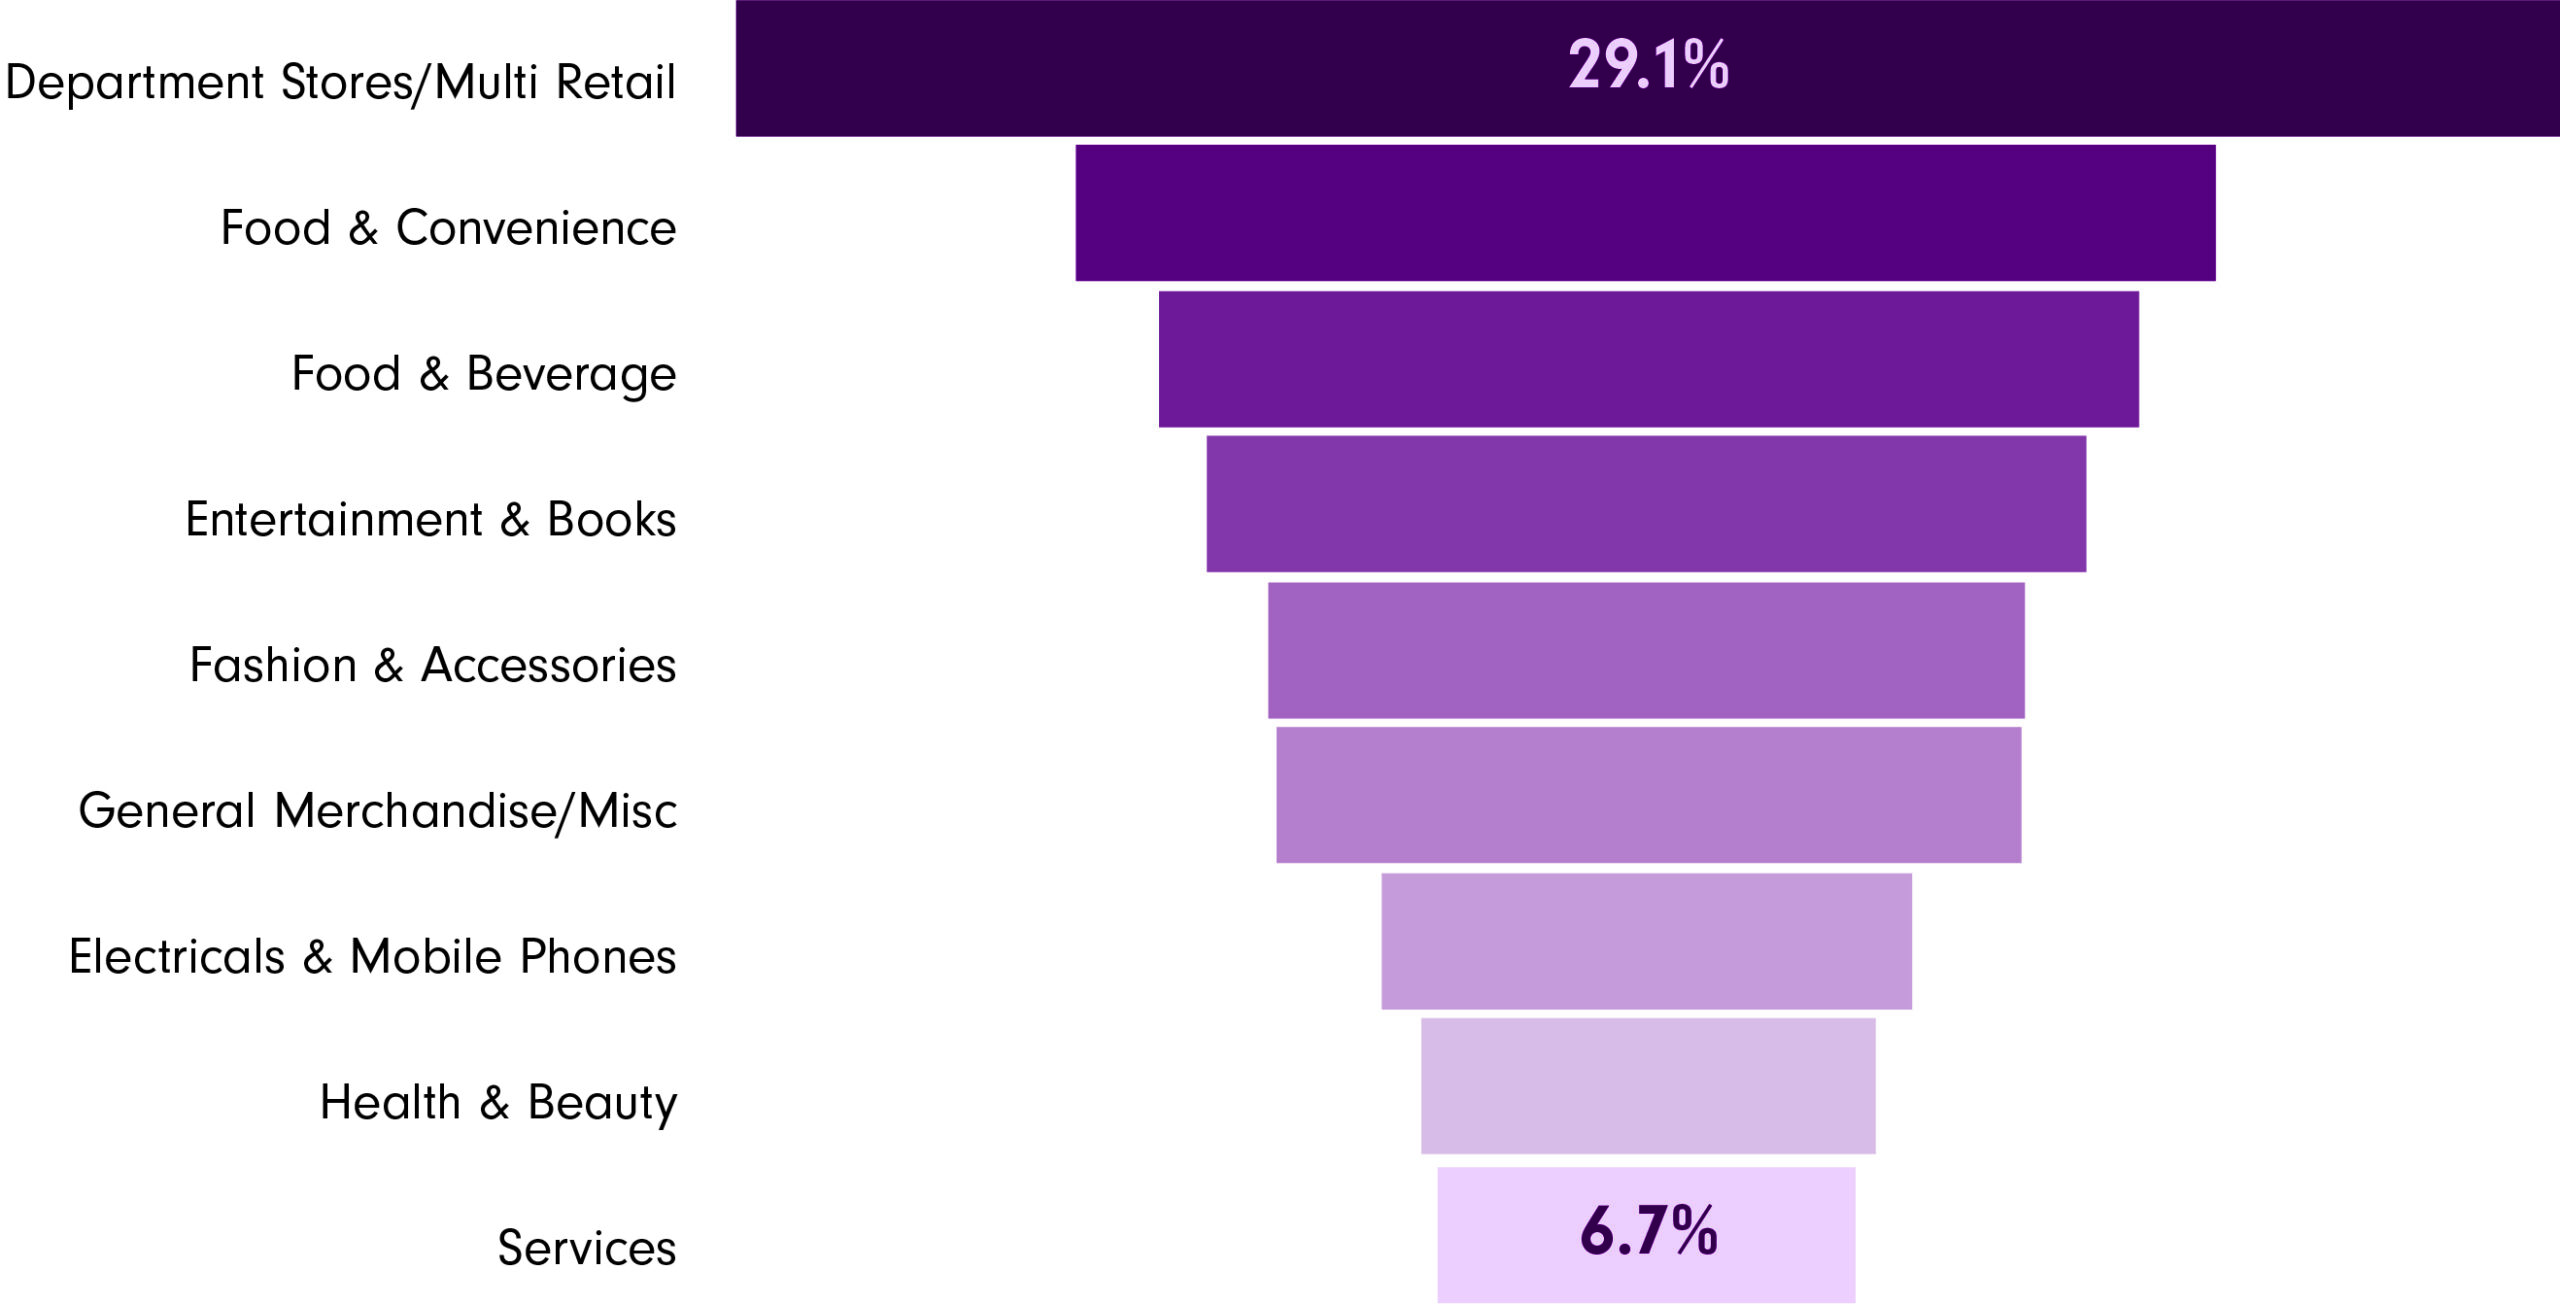
The interplay of these three factors is shown clearly in the difference in Capture Rates between retailer categories. Department stores, with the greatest breadth of offer and brand strength and lowest level of competition, have the highest Capture Rate of any of the 10 retailer categories; whilst Services, Health & Beauty and Electrical & Mobile Phones – of which there is a plethora of competing brands all with a narrow offer – have the lowest.
Capture Rates also vary from store to store within a network, depending on the extent of competition within different locations as footfall can be spread across a larger number of stores due to the wider choice that is available. Stores in locations with more competition – typically those with higher footfall – will generally have lower Capture Rates than stores in locations with less competition. But inevitably there will be outliers – stores that have lower than expected Capture Rates – and it is identifying these that provide opportunities to uplift the performance of individual stores and therefore the network as a whole.
The second crucial perspective – the trend in a store’s Capture Rate over time – identifies whether a store is maximizing its potential or whether it is underperforming. A store should be aiming for its Capture Rate to be at least stable, but preferably increasing, over time. If a store’s Capture Rate is declining it indicates that customer numbers in store are either dropping by more than in the location or conversely customers numbers in store are not increasing at the same rate as external footfall. Under either scenario, it means the store is losing market share, and hence its performance is diminishing.
Of course, the key question is how the Capture Rate can be applied to deliver actionable insights. We will be addressing this in our next blog which will be published mid August.
Footfall Analytics
Boost performance with actionable insights based on AI-driven footfall analytics

MRI OnLocation US Monthly Commentary – June 2026
Covering the five-week period between May 31–July 4, 2026
World Cup fever fuels strongest YOY growth in downtown foot traffic since 2022 U.S. foot traffic counts accelerated through June. Downtown visits rose month over month and year over year, marking the strongest year-over-year uplift recorded in June s…