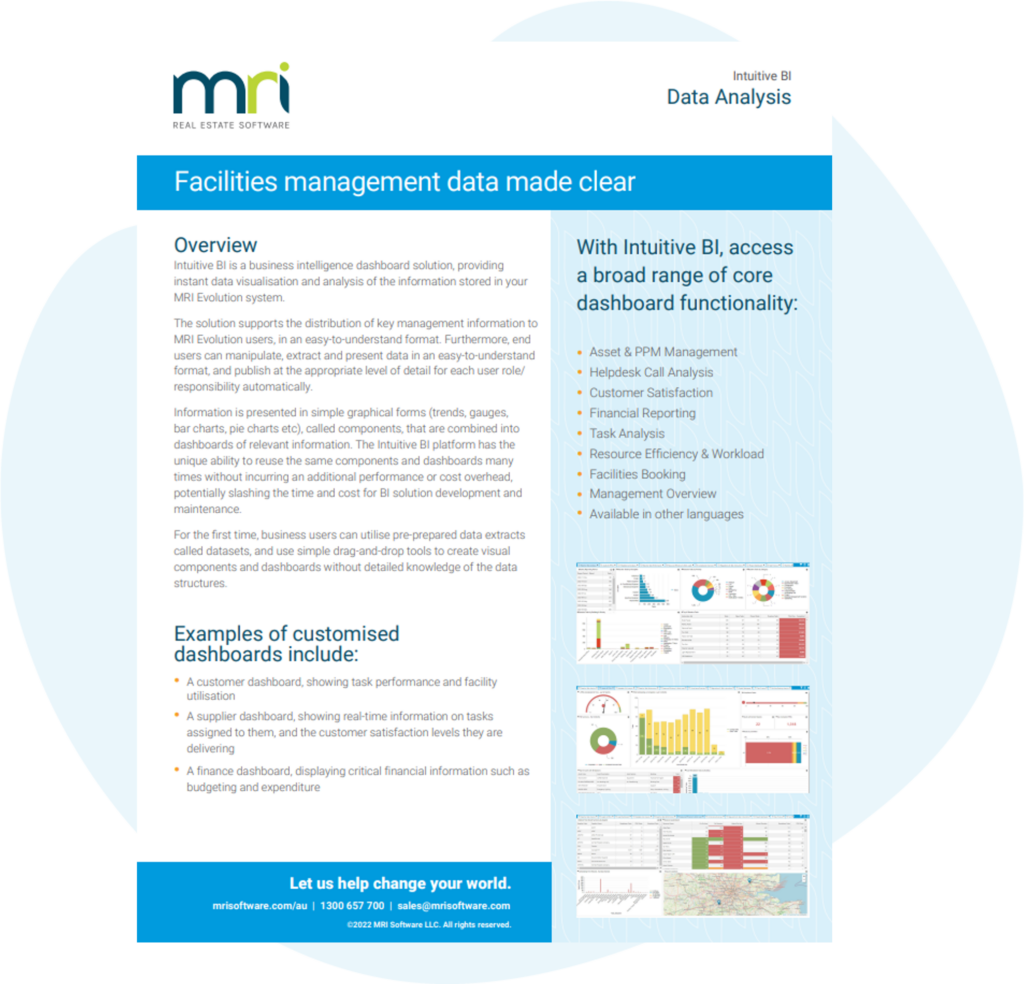
Intuitive BI is a business intelligence dashboard solution, providing instant data visualisation and analysis of the information stored in your MRI Evolution system.
The solution supports the distribution of key management information to MRI Evolution users, in an easy-to-understand format. Furthermore, end users can manipulate, extract and present data in an easy-to-understand format, and publish at the appropriate level of detail for each user role/responsibility automatically.
Information is presented in simple graphical forms (trends, gauges, bar charts, pie charts etc), called components, that are combined into dashboards of relevant information. The Intuitive BI platform has the
unique ability to reuse the same components and dashboards many times without incurring an additional performance or cost overhead, potentially slashing the time and cost for BI solution development and
maintenance.
For the first time, business users can utilise pre-prepared data extracts called datasets, and use simple drag-and-drop tools to create visual components and dashboards without detailed knowledge of the data structures.
