The impact of Covid-19 on rental income in South Africa
On 15 March 2020, South Africa’s president Cyril Ramaphosa declared a national state of disaster due to the coronavirus pandemic that has spread throughout the world. 11 days later (on 26 March), the national lockdown took effect. This meant that all places of business, unless deemed essential, were closed.
MRI Software looked at data from the start of the lockdown to gain insight into what was in store for the South African property market, as described in the 12 August 2020 blog post. The blog post looked at data for rent reductions applied to tenant leases for the upcoming months. It described a bleak picture, whereby all sectors of the market were affected, and a key takeaway from that data was that the retail sector was going to be the hardest hit.
At the time of writing this blog post, South Africa is at level 2 of its lockdown, meaning that we have returned to almost full economic activity. This means that we could look back at the actual income data captured over the last few months and determine the true effect caused by the coronavirus. These findings are discussed in this blog post after analysing rent/levy income from January 2019 up until and including August 2020. The data set used utilized comprises a representative set of MRI Property Central SaaS clients over the period.
Retail sector hit the hardest
Corresponding to our original forecasting data, the retail sector was indeed the worst affected when considering the new historic actual data. Over the 2019 period, the income accrued in the retail sector across the country grew steadily at 4.04% over the year; however, in comparison to the 1st quarter of 2020, the 2nd quarter saw a decrease of 20.79%, with June being the worst affected month so far.
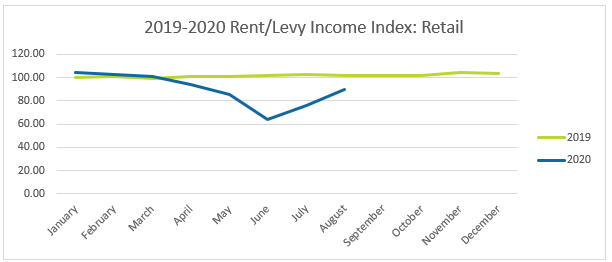
Figure 1: Rent/Levy Income: Retail sector – month on month % change
While each province in South Africa saw a net decrease in rent/levy income during lockdown, the Western Cape was the worst affected: it saw 19.44% of its net income removed through passing credits through to tenants. This was followed by Gauteng at 8.17%. The Eastern Cape was the least affected at 1.82 %.
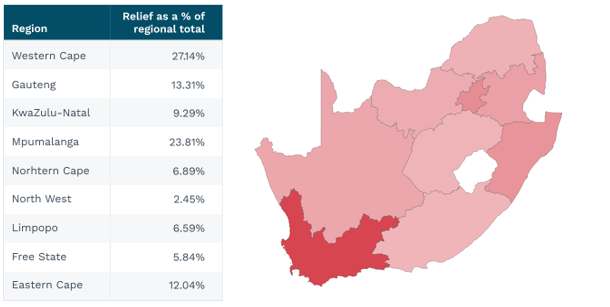
Figure 2: Rent relief provided as a % of gross rent/levy income in 2020Q2 per province/region and corresponding heatmap representation
The Western Cape is believed to have been impacted on a much larger scale due to its weighting in the retail sector. The province receives 43% of its rental income from the retail sector, as compared to Gauteng’s 34%.
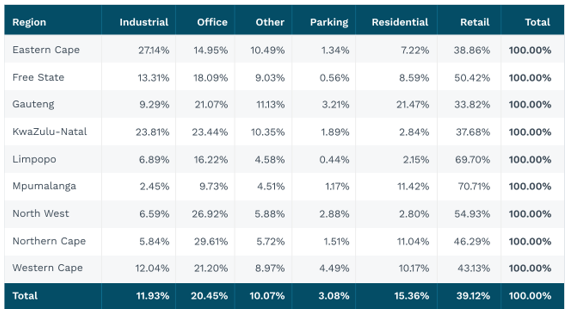
Figure 3: Matrix table showing weighting of sector per province based on total transaction amounts
This effect on the retail sector can be expected, since most retail outlets and restaurants rely on their property to be able to conduct business; with non-essential businesses having to close their doors, they were unable to operate. While some did manage to adapt to take sales and deliveries online, the majority of the businesses were unable to make any turnover, meaning that they required assistance from their landlords in the form of rent relief.
The impact of the retail sector’s decline on the Western Cape can also be expected when considering how it is much more reliant on both local and international tourism, with restaurants and shopping centers targeting many non-local cliental.
Residential sector holding steady
Residential sourced income has not seen the decline that other sectors had experienced. While a decline did occur from April 2020 through August 2020, it is still sitting at 2019 levels.
Even though the residential sector has not been impacted as severely as others, it is believed that longer lasting effects are still to come. Residential rent may experience a lag in this aspect, as individuals who were no longer earning an income due to lockdown may have been able to pay rent for a few months before their savings ran out. Additionally, rent relief is less likely from landlords in the residential sector, as that rental income is also an important source of income to individual landlords. This is in contrast to retail and offices which fall under commercial landlords who may be in a better position to offer such relief.
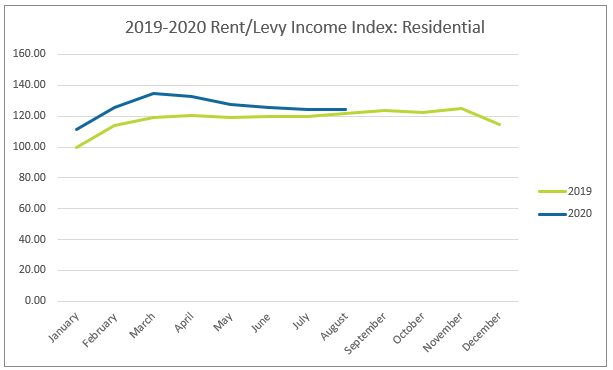
Figure 4: Rent/Levy income index: Residential sector
The above findings on the residential sector also provides insight into why Gauteng was not affected as severely as the Western Cape. The 10% difference in weighting of the retail sector between the two provinces is reversed in the weighting of the residential sector, where Gauteng has 21% of its income sourced from the residential sector compared to the 10% seen in the Western Cape.
Analysing data towards the end of the year will provide a better indication about the long-term effects caused by the lockdown on the residential sector.
Office and Industrial sectors lead the recovery
Finally, when examining the commercial office and industrial sectors, loss of income to landlords was not as severe as that seen by the retail sector. Together, these industries saw their worst month in May 2020, however by June they had kickstarted their recovery, and by August they were surpassing 2019 levels.
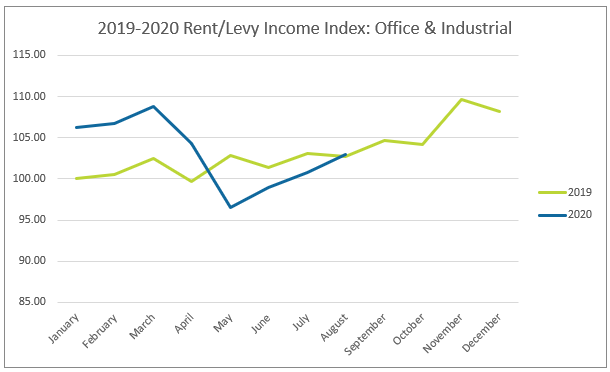
Figure 5: Rent/Levy income index: Office + Industrial sector
The lower levels of income loss to the landlords of these sectors is possibly due to two factors. Firstly, while retail is highly dependent on is physical property to operate, commercial office-based businesses are not. Many companies were able to quickly adapt to a remote work environment and in many cases, were still able to offer all services with no interruption. Secondly, since many companies were able to adapt, they could remain in business and still pay rent, even if they were not physically in the office.
With the office and industrial sectors starting their recoveries in June, it is welcomed that the retail sector has started seeing a recovery from July that continued into August as property owners began to accrue income at an increasing rate. All sectors combined have experienced an increase of 14.12% from June until the end of August.
Data assumptions made:
- Only properties based in South African region were included
- Data is representative of 400+ MRI Property Central SaaS clients
- Only rent and levy income charges were included, this does not include bad debt write offs or other recoveries
- This does not represent non-collection of rent
Multi-discipline technology for property owners, investors and occupiersProperty Management Software

The TPN Voice of the Commercial Tenant Report 2026
TPN’s inaugural commercial tenant report reveals what’s shaping occupier decisions Based on feedback from 950 tenants across retail, office, industrial and mixed-use sectors, TPN Credit Bureau’s 2026 Voice of the Commercial Tenant Report provid…