Market Insights for July in affordable, public, and multifamily housing
Throughout July, the multifamily, affordable and public housing markets in North America continued to deal with what could charitably be described as a cruel summer.
With the ongoing spread of COVID-19, the MRI Market Insights Team continued its reporting on the impact of the pandemic on the conventional multifamily housing market, as well as the affordable and public housing sectors. Comparing key metrics from January through July 2020 to the same months in 2019, the Market Insights team found that in the multifamily market, some of the positive trends from June receded while others continued their upward trajectory; however, in the affordable and public housing markets, trends continue to lag behind 2019’s numbers.
A mixed bag in multifamily
While July brought some changes to the key metrics we’ve been tracking in the multifamily space, move-in volumes continued an upward trajectory from June, hitting a post-pandemic high of 86% of 2019’s volume. This is the third consecutive month of improvement for move-in volumes. When it comes to traffic, this metric dipped from June to July but still remains 16% ahead of prior year volumes and remains a positive indicator.
Much like burgers on an uneven grill, however, several other metrics didn’t turn out as well. When the June report showed application volume reaching 97% of 2019’s numbers, we were hopeful that these numbers would continue to rise. Instead, that metric dropped down to 81% of prior year volumes. In addition, new lease pricing gave back the 5% regained in July, and expiration management practices are quite visible with eight- and nine-month terms being 7% off prior year with 14-month terms only 3% off 2019.
Affordable and public continue to lag
On the whole, all metrics in the affordable and public housing spaces lag behind 2019’s pace. One of the most notable changes is in rent collections, where affordable and public both experienced opposite changes. In affordable housing, rent collections dropped below 80% in July for the first time in 2020. This is similar to the drop public housing saw in June, but since then, that number has leapt back up to 98%.
When it comes to applications, move-out certifications, and new admission certifications, the differences in affordable and public housing are more apparent. In the affordable sector, there’s been a sustained drop in applications and move-out certifications, with new admission certifications again falling as compared to 2019 after a bit of recovery in June. Public housing has been impacted more substantially across these three metrics with trends continuing well off of 2019 volumes.
Even with trends diverting from one another on a seemingly consistent basis, the multifamily, affordable, and public housing sectors all share one attribute in common. As uncertainty around governmental assistance for displaced workers, unemployment, and case spikes in major metro areas continues, residents are staying in place. To learn more about the impacts of COVID-19 on housing, be sure to read the full reports on the affordable, public, and multifamily sectors.
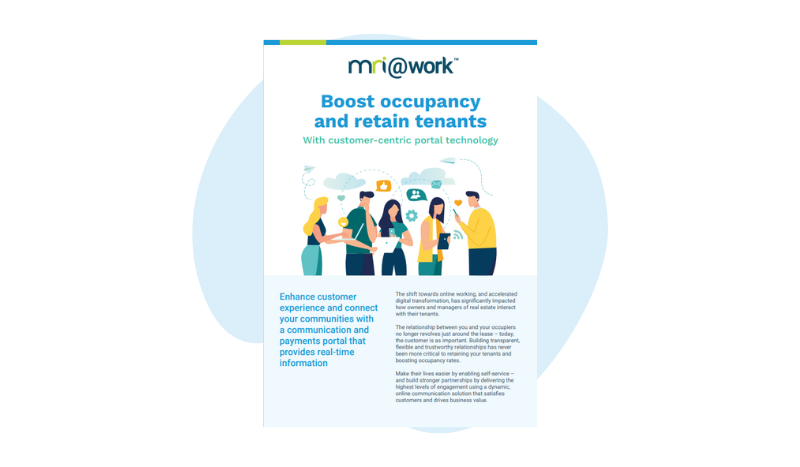
MRI Engage for @Work Brochure
Enhance customer experience and connect your communities with a communication and payments portal that provides real-time information The shift towards online working, and accelerated digital transformation, has significantly impacted how owners and …

